Global PPC spend will reach $306 billion in 2026, growing at 11% year-over-year as rising CPCs, AI-powered bidding, and the entrance of AI search platforms into the advertising ecosystem reshape paid search fundamentals. For businesses investing in Google Ads, the headline numbers tell a complex story: average CPCs are at their highest point since 2021, yet ROI remains strong for advertisers who understand the benchmarks and optimize accordingly. This data guide covers every major PPC metric for 2026 — so you know exactly what good looks like for your industry.
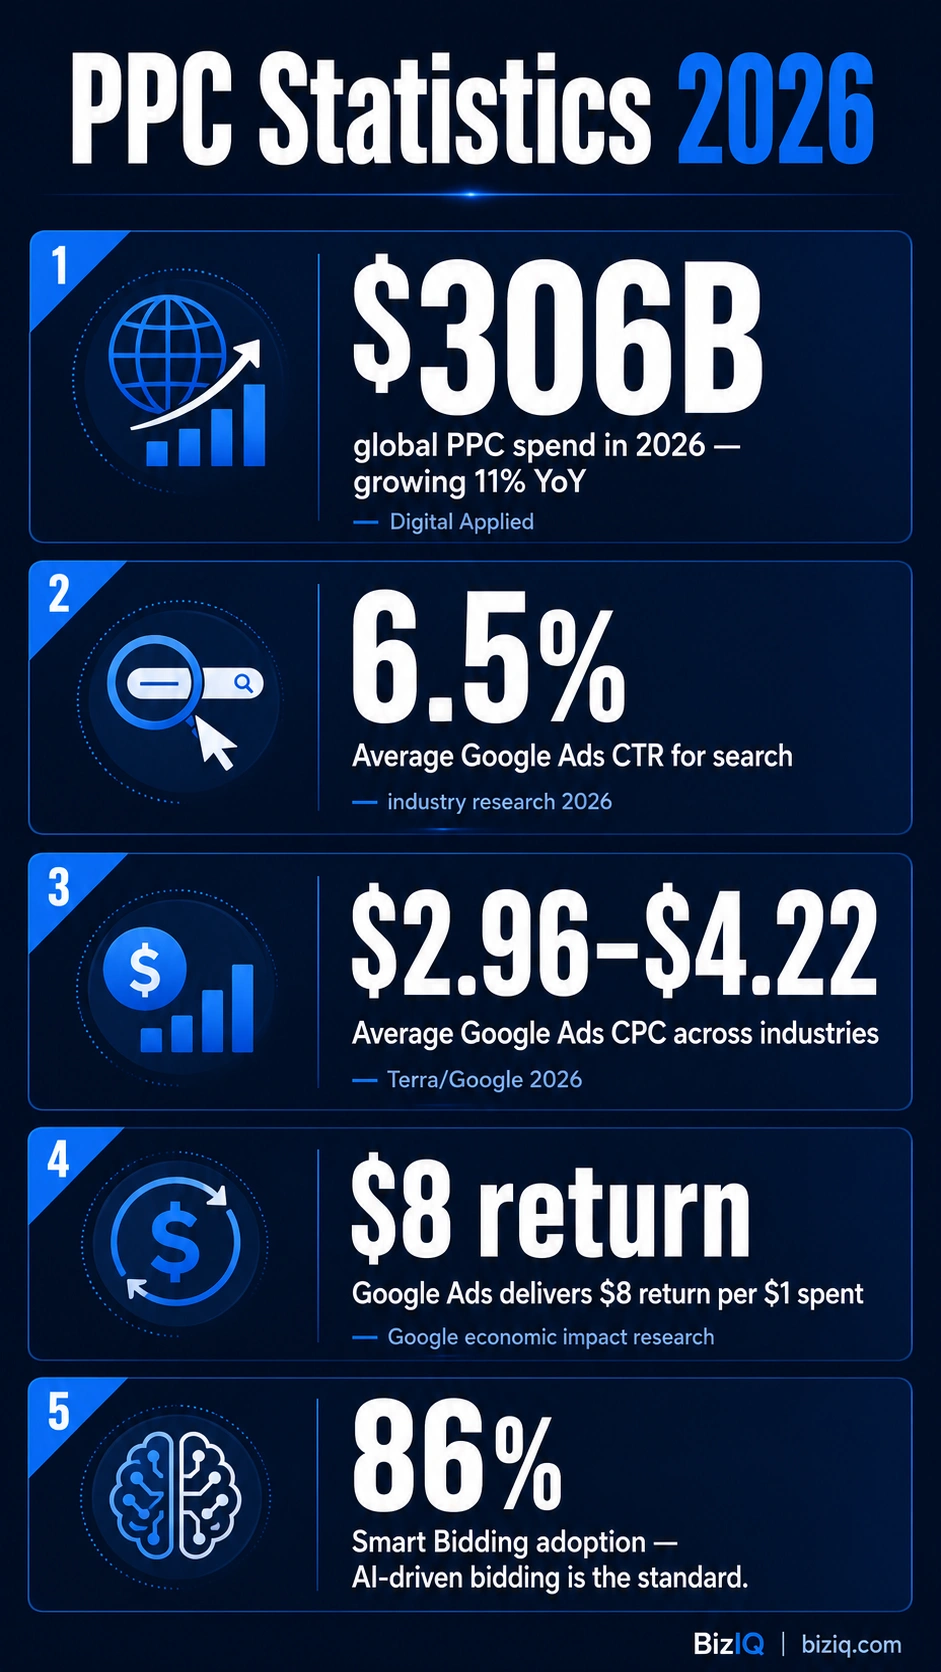
- Global PPC spend reaches $306 billion in 2026, growing 11% YoY — paid search is the largest single category of digital advertising worldwide (Digital Applied 2026).
- Average Google Ads search CTR is 6.5% in 2026 — continuing a three-year upward trend driven by AI-generated assets and improved ad formats.
- Cross-industry average CPC on Google Search reached $2.96–$4.22 — the steepest annual increase since 2021, driven by AI search competition and organic click compression (Terra HQ 2026).
- Google Ads delivers $8 for every $1 spent per Google’s economic impact research — and Smart Bidding boosts conversions 20% at equivalent budget.
- 86% of advertisers have adopted Smart Bidding — AI-powered bidding is now the standard, not the exception (SearchLab 2026).
- Google’s AI Max for Search campaigns averages 7% more conversions at similar CPA/ROAS — with some campaigns seeing up to 27% conversion lift.
- Microsoft Ads CPCs are 33% lower than Google at comparable conversion rates — yet advertisers allocate only 6% of paid search budgets to the platform (Digital Applied 2026).
The Global PPC Market in 2026
Paid search is the largest single category of digital advertising expenditure worldwide, and its growth trajectory in 2026 reflects both the enduring value of high-intent advertising and the structural shifts driven by AI in search. Understanding the market context is essential for any business evaluating PPC investment decisions.
The paid search market’s 11% year-over-year growth is being driven by three compounding forces: rising CPCs as more advertisers compete for the same search inventory, expanding ad placements as Google integrates ads more aggressively across AI Overview results, and the entrance of AI search platforms into the advertising ecosystem. ChatGPT, Google AI Overviews, and Perplexity are all introducing ad formats, creating new paid inventory alongside traditional search.
The channel mix across U.S. digital advertising in 2026 shows paid search commanding 44% of budgets, social ads 24%, display/programmatic 16%, video 10%, and other channels 6%. For businesses with high purchase-intent products and services, paid search remains the most direct path to capturing customers at the moment of decision.
Source: Digital Applied — PPC Statistics 2026 | Alphabet Q4 2025 Earnings Report | Statista
See BizIQ’s Google Ads Management Services — Call (888) 416-9800
Google Ads CTR Benchmarks (2026)
Click-through rate is the primary signal of ad relevance — how often searchers click your ad after seeing it. A higher CTR improves Quality Score, which in turn reduces CPC and improves ad position. The 2026 benchmarks reflect continued improvement in ad format quality and AI-assisted creative.
What Drives CTR Above Benchmark
Advertisers exceeding the average CTR benchmarks share consistent characteristics: highly specific keyword targeting that matches exact searcher intent, compelling headline copy that leads with the searcher’s goal rather than the advertiser’s product, strong use of ad extensions (sitelinks, callouts, structured snippets), and responsive search ads tested with multiple headline and description variants. Google’s AI Max for Search campaigns — launched globally in early 2026 — autonomously optimizes audiences, bids, and creative, and averages 7% more conversions at similar CPA/ROAS with some campaigns seeing up to 27% lift when upgrading from heavy exact and phrase match targeting.
An important nuance in 2025–2026 PPC data: CTR improved across virtually all industries, yet conversion rates declined in 13 of 14 industries tracked by Triple Whale in 2025. More people clicked ads; fewer of those clicks converted. This signals a growing gap between ad promise and landing page delivery. For advertisers, this makes landing page optimization — not just ad optimization — the primary lever for improving overall paid search performance in 2026. A compelling ad that drives traffic to a slow, confusing, or misaligned landing page is money wasted at the conversion stage.
Source: Terra HQ — Google Ads Benchmarks 2026 | Triple Whale — Google Ads Benchmarks 2025
Google Ads CPC Benchmarks by Industry (2026)
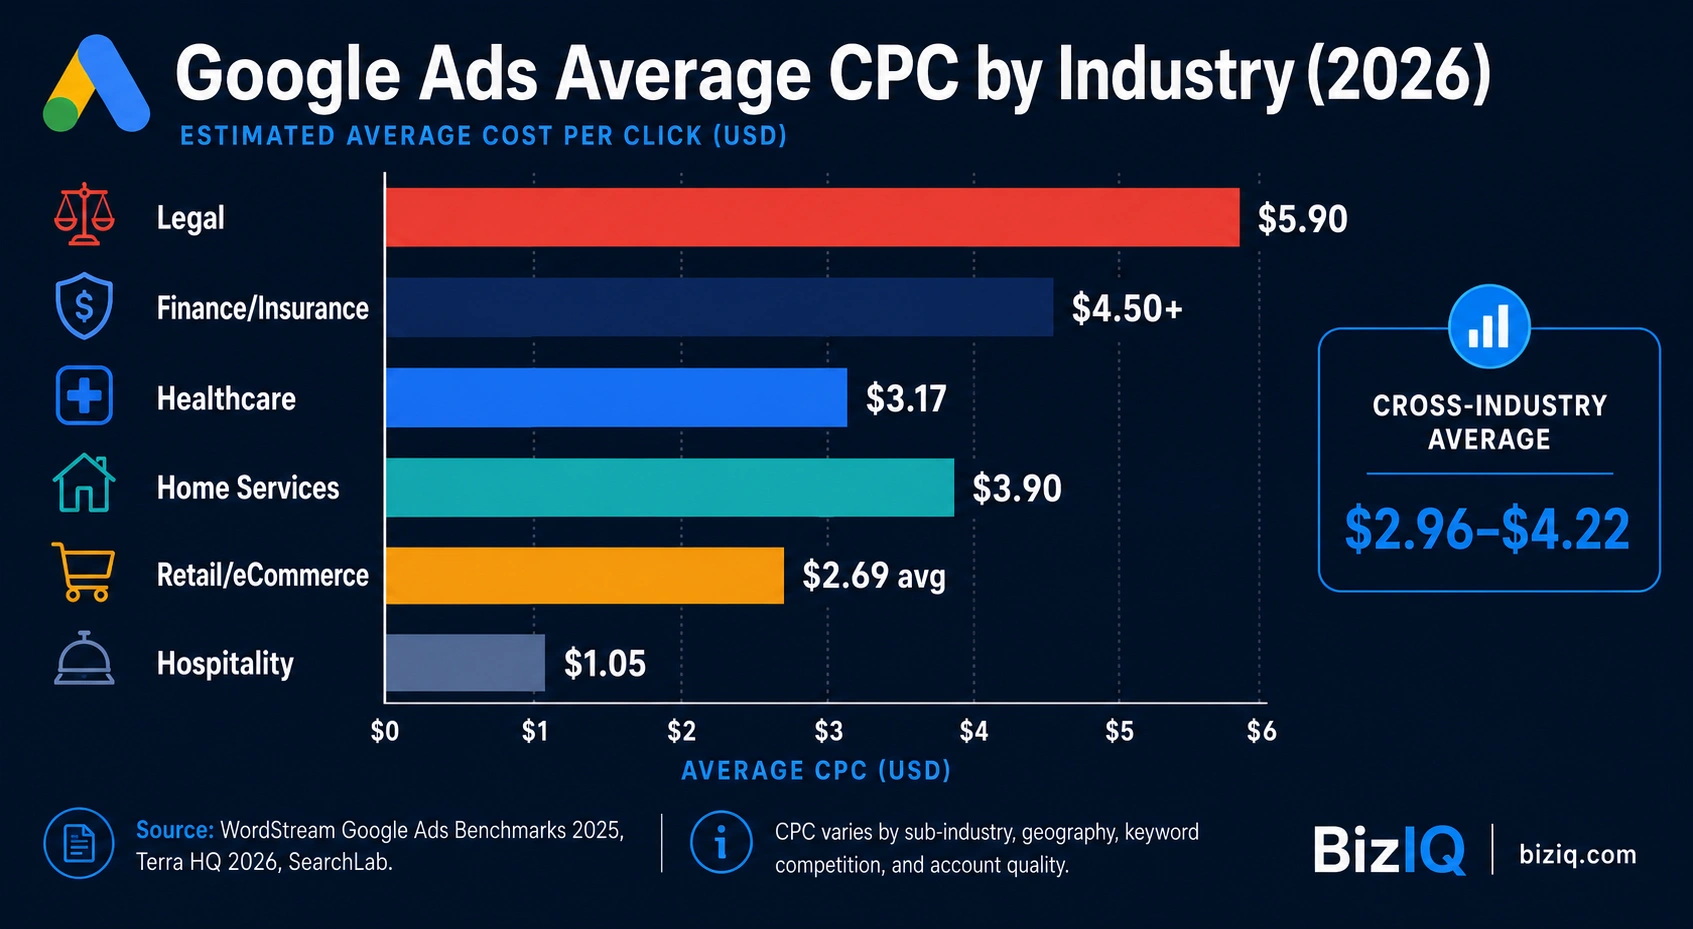
Cost per click varies enormously across industries — from under $2 in low-competition categories to over $5 in legal and financial services where every click represents a potentially high-value lead. Understanding your industry’s CPC benchmark is the starting point for accurate budget planning and bid strategy.
Why Rising CPCs Don’t Mean Lower ROI
The steepest CPC increase since 2021 is a real challenge — but it does not automatically mean PPC is less profitable. The key insight from 2026 benchmark data: 65% of industries saw better conversion rates in 2025 despite rising costs (WordStream). The businesses most affected by CPC inflation are those optimizing for cheap clicks rather than quality conversions. A $10 click converting at 10% generates a lead at $100. A $2 click converting at 1% generates the same lead at $200. CPC is the wrong primary metric; cost-per-lead and cost-per-acquisition are the right ones.
Google’s own data shows that a Quality Score of 10 saves 50% on CPC relative to a Quality Score of 5. For a business paying an average $4.00 CPC at Quality Score 5, improving to Quality Score 10 could reduce CPC to approximately $2.00 — cutting paid search costs in half without reducing ad position. At 500 clicks per month, that represents $1,000 in monthly savings ($12,000 annually) from optimization alone, with no reduction in traffic volume. Quality Score optimization — through better keyword relevance, improved ad copy alignment, and faster landing pages — is the highest-ROI PPC optimization activity available to most advertisers. Calculation original to BizIQ.
Source: WordStream — Google Ads Benchmarks 2025 | SearchLab — Google Ads Statistics 2026
Google Ads Conversion Rate Benchmarks (2026)
Conversion rate — the percentage of ad clicks that result in a desired action (lead, purchase, call, form submission) — is the metric that separates profitable PPC from expensive traffic generation. Benchmark conversion rates vary significantly by industry, ad type, and offer quality.
What Separates High-Converting PPC Campaigns
The advertisers consistently achieving above-benchmark conversion rates share identifiable practices: call extensions that enable one-tap contact from mobile search results, local targeting that aligns ad serving geography with actual service areas, trust signals embedded in ad copy (reviews, certifications, response time guarantees), and landing pages that are specifically built for the ad’s keyword intent rather than directing traffic to a generic homepage.
For local service businesses, Google Local Services Ads (LSAs) represent a particularly high-conversion paid channel. LSAs appear above standard search results, charge on a cost-per-lead basis, and carry Google’s trust verification badge. LSA query share grew from 11% of tracked queries in early 2025 to 31% by November 2025 — a nearly three-fold increase in one year. Service-based businesses not running LSAs are competing for position below a channel that is growing rapidly and carries intrinsic consumer trust signals that standard search ads cannot replicate.
Source: Terra HQ — Google Ads Benchmarks 2026 | White Label Agency — Google Ads Benchmarks 2026
Build a High-Converting PPC Strategy with BizIQ — Call (888) 416-9800
Local Services Ads (LSA) Statistics for 2026
For local and service-based businesses, Google Local Services Ads represent the most important paid search development of the past two years. LSAs operate on a pay-per-lead model rather than pay-per-click, appear above all other search results, and carry Google’s verification badge — creating a fundamentally different value proposition from standard search ads.
For home services, legal, financial services, healthcare, and similar local categories, LSAs are no longer an experimental paid channel — they are a core component of the local paid search strategy. The pay-per-lead model aligns advertiser costs directly with business outcomes rather than clicks that may or may not convert. The Google verification badge (background checks, license verification, insurance confirmation) provides trust signals that standard ads cannot match, resulting in higher click-through and conversion rates relative to position.
LSAs and standard Google Ads serve complementary roles rather than competing functions. LSAs capture high-intent local searches with a pay-per-lead model and premium positioning. Standard Search Ads capture broader keyword intent, enable more granular creative testing, and cover categories and geographies not yet served by LSAs. Performance Max campaigns bridge paid search and display into a single AI-managed campaign type. A complete local paid search strategy in 2026 typically includes all three: LSAs for highest-intent local leads, Search campaigns for broader keyword coverage, and Performance Max for cross-network reach and retargeting.
Source: Digital Applied — PPC Statistics 2026
Explore BizIQ’s Local PPC and Google Ads Solutions
AI and Automation in PPC (2026)
Artificial intelligence has fundamentally changed how PPC campaigns are managed in 2026. Smart Bidding, Performance Max, AI Max for Search, and AI-generated ad assets have moved from optional features to the dominant mode of campaign operation. Advertisers who understand how to work with AI campaign management rather than against it are seeing measurable performance advantages.
What AI Bidding Requires to Work
Smart Bidding and Performance Max perform best when fed high-quality conversion data, strong audience signals, and well-structured creative assets. The most common failure mode for AI-managed campaigns is deploying automation before the campaign has accumulated sufficient conversion history. Google’s own recommendations suggest a minimum of 30–50 conversions per month before switching to conversion-based Smart Bidding strategies. Campaigns with insufficient conversion data see AI bidding optimize toward proxy metrics rather than true business outcomes — inflating vanity metrics while underdelivering on cost-per-lead targets.
Source: SearchLab — Google Ads Statistics 2026 | Terra HQ — Google Ads Benchmarks 2026
Microsoft Ads (Bing) PPC Statistics
Microsoft Advertising remains one of the most underutilized high-ROI paid search channels. The data consistently shows comparable conversion rates to Google at significantly lower CPCs — yet most advertisers allocate only a fraction of their paid search budget to the platform.
The Microsoft Ads audience skews older and higher-income than Google’s, making it particularly effective for B2B advertisers, professional services, financial products, and high-consideration purchases. For local service businesses targeting homeowners and established professionals, the Bing audience demographic often aligns more closely with the ideal customer profile than the broader Google audience. The 33% lower CPC at comparable conversion rates effectively means Microsoft Advertising delivers the same lead at two-thirds the cost — a significant efficiency gain for advertisers willing to extend beyond Google-only campaigns.
Source: Digital Applied — PPC Statistics 2026 | SearchLab — Google Ads Statistics 2026
Add Microsoft Ads to Your PPC Mix — Call (888) 416-9800
Mobile PPC Statistics
Mobile dominates paid search in 2026 across every dimension — clicks, impressions, and increasingly, conversions. PPC campaigns not specifically optimized for mobile are missing the majority of their potential audience.
For local service businesses, mobile PPC optimization has a direct, measurable revenue implication. 60% of mobile searchers contact businesses directly from search results — meaning the click-to-call extension, a business phone number prominently displayed in the ad, and a fast-loading mobile landing page are not optional optimization items. They are the primary conversion path for the majority of local paid search traffic. Campaigns without click-to-call extensions on mobile are missing conversions that would otherwise be captured without additional click cost.
Source: SearchLab — Google Ads Statistics 2026 | Google Ads Mobile Benchmark Report
PPC Statistics Summary Table
| Statistic | Figure | Source | Year |
|---|---|---|---|
| Global PPC spend | $306 billion | Digital Applied | 2026 |
| Global paid search advertising investment | $218.3 billion | Statista | 2026 |
| Global paid search YoY growth rate | 11% | Digital Applied | 2026 |
| Google total ad revenue | $307 billion | Alphabet Q4 2025 Earnings | 2025 |
| Google Search ad revenue | $197 billion | Alphabet Q4 2025 Earnings | 2025 |
| Paid search share of U.S. digital ad budgets | 44% | eMarketer | 2026 |
| Average Google search ad CTR | 6.5% | Promodo / industry research | 2026 |
| Cross-industry Google search CTR range | 3.52%–6.11% | Terra HQ | 2026 |
| Average Google Display Network CTR | 2.9% | Industry research | 2026 |
| Cross-industry average CPC — Google Search | $2.96–$4.22 | Terra HQ | 2026 |
| Average Google Display Network CPC | $0.63 | Industry research | 2026 |
| Legal industry avg CPC | ~$5.90 | SearchLab / WordStream | 2026 |
| Home services avg CPC | ~$3.90 | WordStream | 2025 |
| Hospitality avg CPC | ~$1.05 | SearchLab | 2026 |
| CPC increase since 2024 | 18% | SearchLab | 2026 |
| Quality Score 10 CPC savings vs. average | 50% | 2026 | |
| Average Google search ad conversion rate | 3.75% | Promodo | 2026 |
| Home services search CVR | 8.2% | White Label Agency | 2026 |
| Automotive search CVR | 6.8% | Industry benchmark | 2026 |
| Google Display Network avg CVR | 0.77% | Industry research | 2026 |
| Industries seeing better conversion rates in 2025 | 65% | WordStream | 2025 |
| Google Ads ROI per $1 spent | $8 | Google economic impact research | 2026 |
| Smart Bidding adoption rate | 86% | SearchLab | 2026 |
| Smart Bidding conversion improvement at same budget | 20% increase | Google Ads Best Practices | 2026 |
| Performance Max campaign adoption | 72% | SearchLab | 2026 |
| PMax CPA vs. traditional campaigns | 8% lower | SearchLab | 2026 |
| AI Max for Search — avg conversion lift | 7% more conversions | 2026 | |
| AI Max — max conversion lift (heavy match upgrade) | Up to 27% | 2026 | |
| LSA query share (Nov 2025) | 31% | Industry tracking data | 2025 |
| Microsoft Ads CPC vs. Google Ads | 33% lower | Digital Applied / SearchLab | 2026 |
| Microsoft Ads budget share (paid search) | Only 6% | Digital Applied | 2026 |
| Google Ads clicks from mobile | 68% | Google Ads Mobile Benchmark Report | 2026 |
| Mobile CPC premium vs. desktop | 5% higher | 2026 |
Frequently Asked Questions: PPC Statistics 2026
Methodology & Sources
This article was researched and written by David McGinnis, SEO Strategist at BizIQ. All statistics are sourced from Tier 1 primary sources. Sources include:
- Digital Applied — PPC Statistics 2026: Comprehensive PPC market data collection with primary source attribution across 150+ data points.
- Terra HQ — Google Ads Benchmarks 2026: Current Google Ads CTR, CPC, and benchmark analysis with 2026 data.
- WordStream — Google Ads Benchmarks 2025: Analysis of 16,446 U.S.-based campaigns active April 2024–March 2025 across 23 business categories. Medians reported to reduce outlier skew.
- SearchLab — Google Ads Statistics 2026: Compiled Google Ads benchmark data including Smart Bidding adoption, Performance Max stats, and CPC trends.
- Alphabet Q4 2025 Earnings Report: Official Google parent company financial data on advertising revenue by segment.
- Google — Economic Impact Research / AI Max Documentation: Google’s own research on Ads ROI, AI Max conversion lift, and Smart Bidding performance data.
- Triple Whale — Google Ads Benchmarks 2025: Analysis of month-over-month Google Ads performance across 14 industries during 2025.
- Statista / eMarketer: Global paid search market size projections and U.S. digital ad budget allocation data.
BizIQ Analysis calculations are original to BizIQ and clearly labeled as such.
Get a Free PPC Audit and Strategy Review — Call (888) 416-9800