The U.S. franchise industry is on track to exceed $921 billion in economic output in 2026 — and how individual franchise locations win or lose customers increasingly comes down to one factor: digital marketing execution at the local level. With 65% of new franchise leads now originating from online campaigns and 72% of franchise systems putting at least 40% of their marketing budgets into local SEO, the data is unambiguous about where franchise growth is being won and lost.
- The U.S. franchise industry is projected to reach 845,000 establishments and $921B+ in output in 2026 (IFA/FRANdata).
- 65% of new franchise leads originate from digital marketing campaigns — Google search, paid ads, and social platforms dominate.
- 72% of franchise systems allocate at least 40% of their marketing budget to local SEO — the highest-ROI channel in the mix.
- Google Business Profile actions increased 41% year-over-year; GBP is now the #1 local visibility lever for franchise locations.
- Franchise PPC campaigns average a 3.5x ROI, making paid search one of the most predictable lead channels for franchise recruitment and sales.
- 19.3% of franchisees now operate multiple units and collectively control 58.8% of all franchised locations (FRANdata 2026).
- Consumer interest in franchising hit its highest recorded level at the end of 2025 into January 2026, driving unusually high ad conversion rates and the lowest cost-per-lead in two years (Reshift Media).
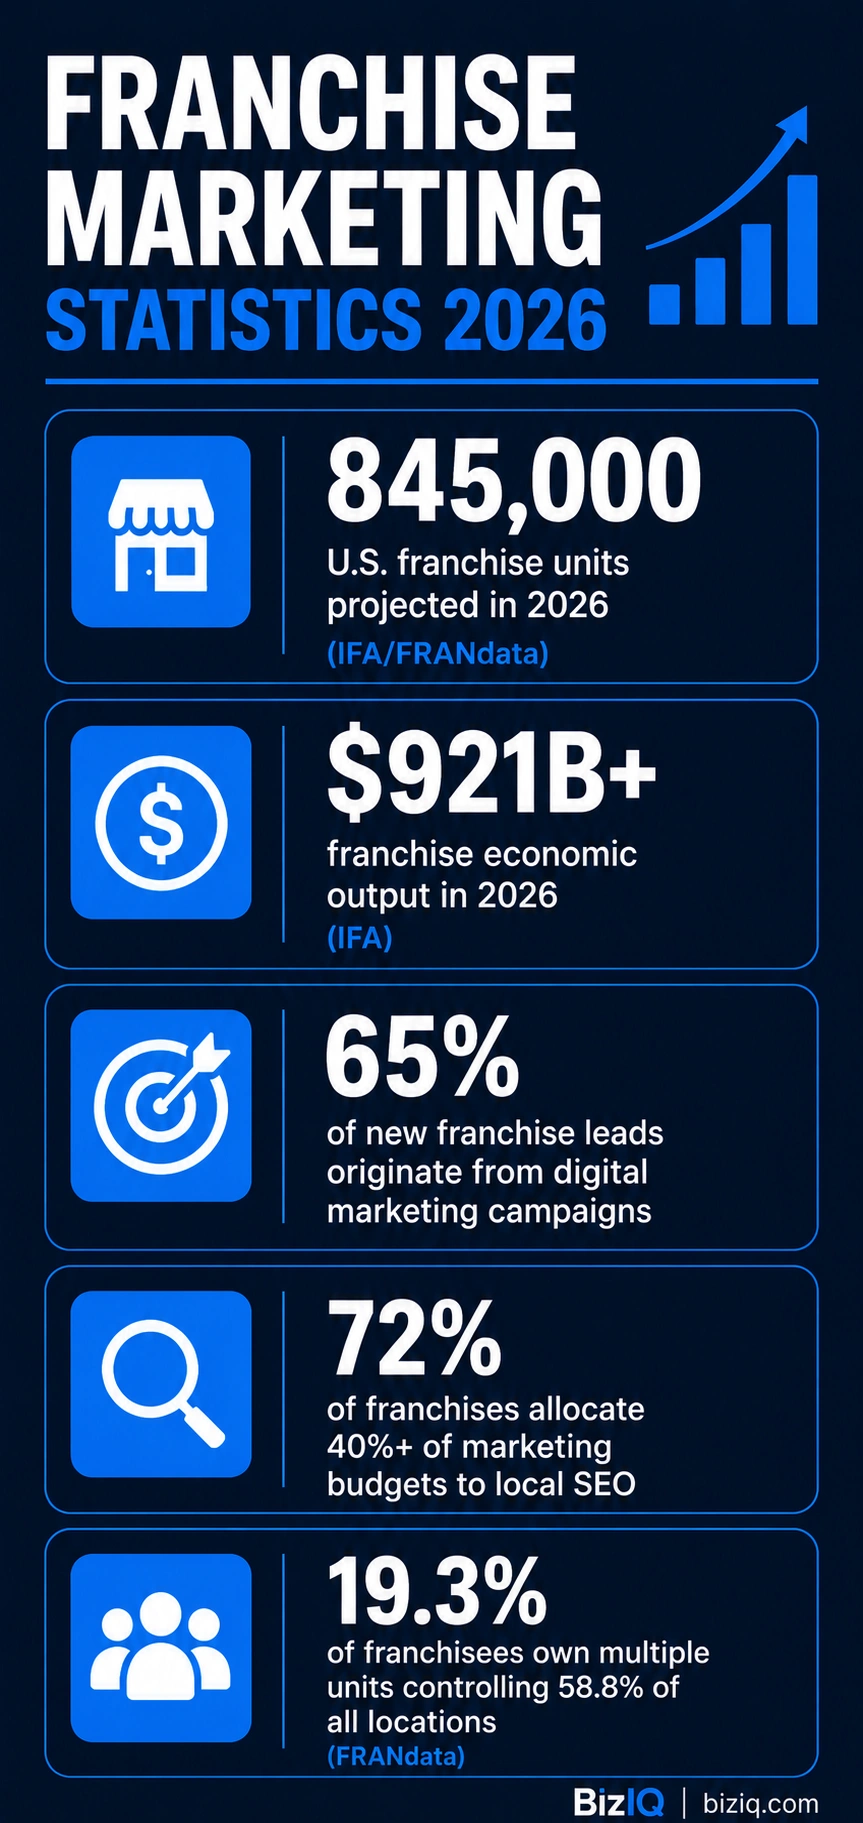
Key franchise marketing statistics for 2026 — sourced from IFA/FRANdata and industry research.
The U.S. Franchise Industry at Scale (2026)
Before dissecting marketing performance, the baseline numbers matter: franchising is one of the largest and most resilient sectors of the American economy. Understanding the scale of the industry contextualizes why franchise-specific marketing — particularly at the local level — requires a fundamentally different strategy than standalone business marketing.
The IFA’s 2026 Franchising Economic Outlook, produced by research firm FRANdata from data tracking approximately 9,000 U.S. franchise brands, projects franchise output rising 1.6% over 2025. Child services and commercial and residential services lead sector growth at 3.2% year-over-year. Arizona is among the top 10 fastest-growing states for franchising — making it a particularly competitive local SEO environment for franchise operators based in Phoenix and the broader Southwest region, which is projected to grow 2.5% in 2026.
The franchisee base itself is consolidating. As of 2025, 19.3% of franchisees operate multiple units and collectively own 58.8% of all franchised locations. For multi-unit operators, the marketing challenge is fundamentally one of scale: maintaining brand consistency while optimizing each location’s local digital presence independently.
If 19.3% of franchisees control 58.8% of all locations (FRANdata 2026), the average multi-unit operator manages approximately 5.8 locations. At 845,000 total projected units, that’s roughly 162,000 multi-unit operators each responsible for an average of nearly 6 separate GBP listings, 6 location pages, and 6 local citation footprints — all requiring consistent NAP data, review management, and local content. This is the operational reality driving demand for franchise-specific SEO management platforms and agencies. Calculation and interpretation original to BizIQ.
Source: International Franchise Association — 2026 Franchising Economic Outlook | FRANdata 2026 Annual Franchise Report
Explore BizIQ’s Franchise SEO Services
Where Franchise Leads Actually Come From
The single most important marketing insight for franchise owners and franchisors is where qualified leads originate. The data consistently points to digital channels — particularly search — as the dominant source. But the channel mix matters, and each channel serves a different stage of the franchise buyer and consumer journey.
Consumer interest in franchising hit its highest ever recorded level at the end of 2025 and into January 2026, according to Reshift Media’s analysis of Google search trends across dozens of high-intent franchise queries. That surge translated directly into performance: January 2026 recorded the highest conversion rates and lowest cost-per-lead of any month in the previous two years for franchise recruitment campaigns. The signal is clear — franchise buyers are searching at record rates and converting at exceptional efficiency.
For consumer-facing franchise locations, the story is identical: potential customers search before they visit. The top three most trusted platforms for researching local businesses are Google (66%), Google Maps (45%), and a business’s own website (36%). For franchise systems, this means every location’s Google Business Profile and local website presence is a direct revenue driver — not a secondary marketing consideration.
Many franchisees assume that national-level brand advertising handles local visibility. The data disproves this. National campaigns build awareness, but 62% of consumers would avoid using a business if they found incorrect or missing information in local search results. A franchise with strong national brand recognition but incomplete or unoptimized individual location profiles loses customers at the local discovery stage — regardless of what the franchisor is spending nationally.
Source: Reshift Media — 2026 Franchise Development Trends Report | HigherVisibility — Franchise Statistics 2025
Get a Free Franchise SEO Consultation — Call (888) 416-9800
Local SEO for Franchises: ROI, Ranking Factors & Budget Data
Local SEO is consistently rated the highest-ROI digital marketing channel for franchise systems. The reason is straightforward: local searches carry immediate purchase intent. When a potential customer searches “oil change near me” or “gym in [city],” they are seconds away from a decision. Franchise locations that appear in the Google Local Pack capture that intent. Those that don’t are invisible at the exact moment it matters most.
Local Pack Ranking Factors for Franchise Locations
Understanding what drives local pack rankings is essential for franchise systems managing dozens or hundreds of locations. The 2025 Local Search Ranking Factors research identifies the following weighted distribution for Google Local Pack rankings:
Google Business Profile signals account for 32% of local pack ranking weight — the single largest factor. For franchise systems, this means GBP optimization at every location is not optional. The primary GBP category, proximity to the searcher, and keywords in the business title are the top three individual factors within that 32% weighting.
The Near-Me Search Opportunity for Franchises
Near-me search volume continues to grow. Google Maps searches for “shopping near me” grew more than 136% in 2023, and that trend has continued. For franchise locations in any service or retail category, appearing in near-me results is the highest-conversion visibility available. The data is consistent: 28% of local searches result in a purchase, and 90% of consumers who search for local business information make a purchase within one week.
Source: BrightLocal — Local SEO Statistics 2026 | Digital Applied — Local SEO Statistics 2026
See How BizIQ’s Local SEO Services Drive Franchise Traffic
Google Business Profile Performance for Franchise Locations
Google Business Profile has evolved from a basic directory listing into the primary storefront for local discovery. For franchise systems managing multiple locations, GBP optimization and ongoing management is the highest-leverage activity in the entire local marketing stack.
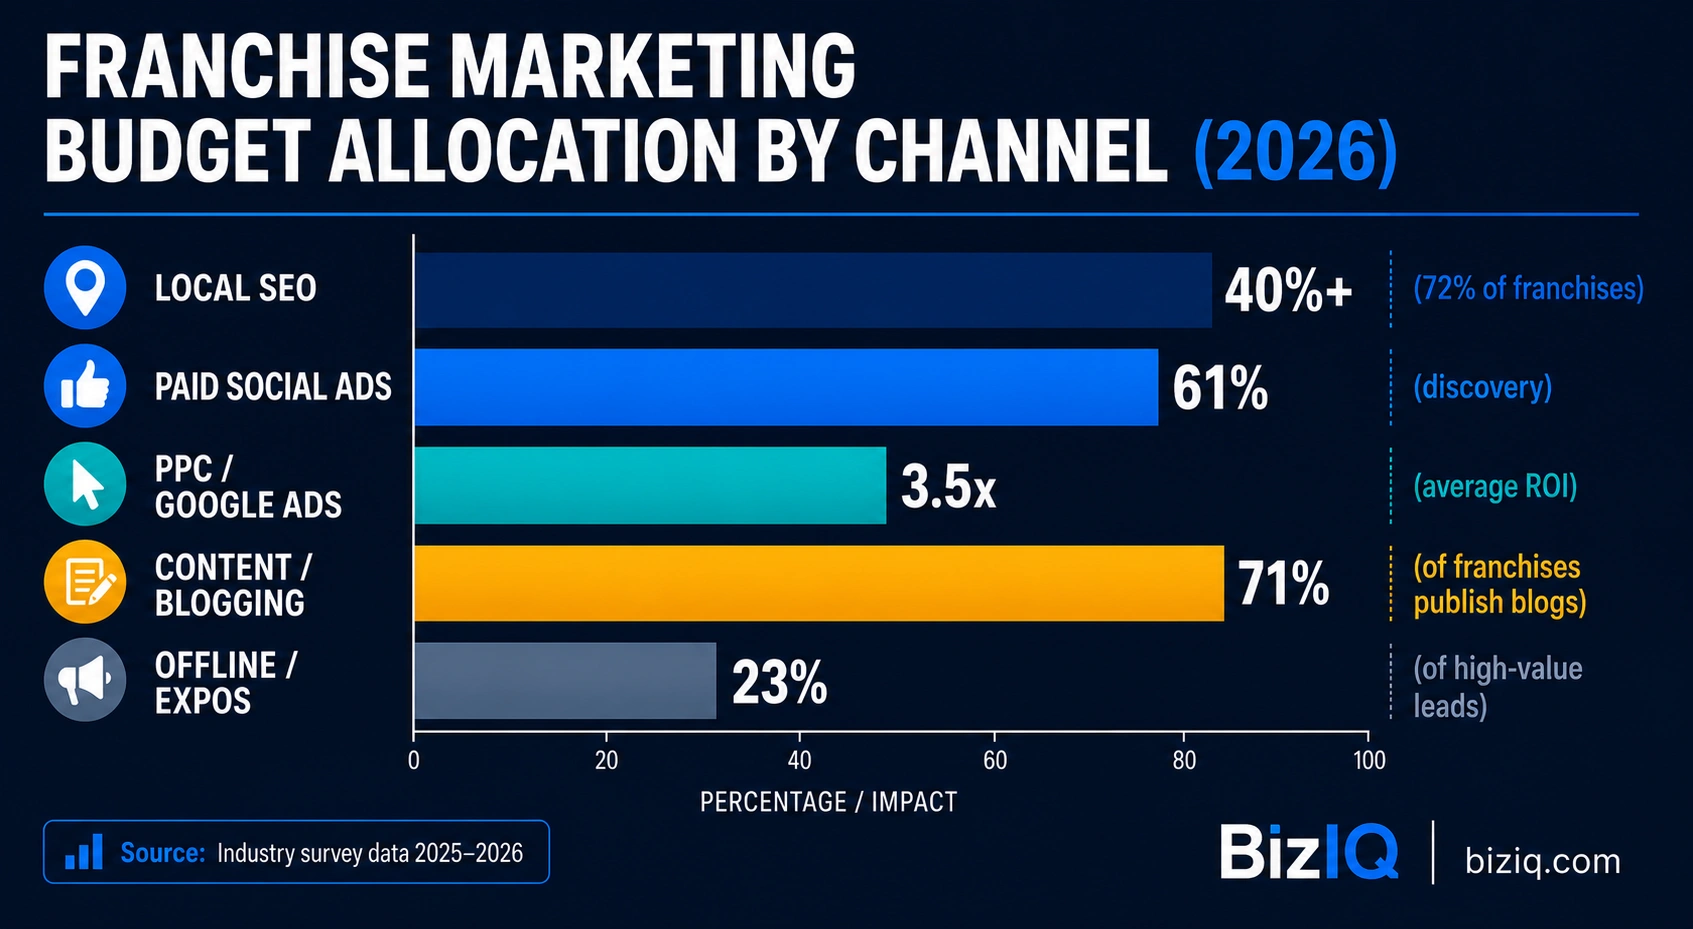
How franchises allocate marketing budgets across channels in 2026 — local SEO commands the largest share. Description: Bar chart infographic showing franchise marketing spend by channel in 2026.
Only 35% of SMBs have a Google Business Profile at all, according to the 2025 SMB Marketing Report. For franchise systems, the opportunity is clear: the majority of the competitive landscape is under-invested in GBP. Franchise locations that fully optimize — complete profiles, regular posts, photo updates, active review management, correct categories, and accurate service area data — gain disproportionate visibility over unprepared competitors.
GBP and AI Search: A New Frontier for Franchise Visibility
In 2026, GBP optimization reaches beyond Google’s traditional local pack. AI-powered search tools including ChatGPT and Perplexity are increasingly being used for local business discovery. Only 68% of business contact information on ChatGPT and Perplexity matches the details on Google Business Profiles, according to the SOCi Local Visibility Index 2026. Franchise systems with inaccurate or incomplete GBP data are being misrepresented — or omitted — in AI search results.
Less than half of businesses that lead in Google local search results also appear in AI local recommendations. The franchise brands that will dominate local discovery in 2026 and beyond are those maintaining accurate, optimized GBP data across every location — because that data flows into AI systems as well as traditional search.
For a franchise system with 50 locations, a 41% increase in GBP actions represents a massive compounding revenue opportunity. If each location averages 200 monthly GBP actions pre-optimization (calls, direction requests, clicks), a 41% lift adds 82 additional customer interactions per location per month — 4,100 additional high-intent interactions across the system monthly. At even a 10% conversion rate, that’s 410 new customer engagements that didn’t exist before GBP investment.
Source: BrightLocal — Local SEO Statistics 2026 | SOCi Local Visibility Index 2026
Set Up and Optimize Your Franchise GBP Listings
Franchise PPC and Paid Advertising Statistics
Paid advertising plays a critical role in franchise marketing — both for franchisee consumer acquisition and for franchisor franchise recruitment. The data shows strong ROI for well-managed campaigns, with clear channel distinctions between what drives consumer traffic and what drives franchise development leads.
Google Local Services Ads for Service Franchises
For service-based franchise systems — home services, automotive, health and wellness, and similar categories — Google Local Services Ads (LSAs) represent an especially high-value paid channel. LSAs appear above standard search results and charge on a cost-per-lead basis rather than cost-per-click. At the start of 2025, LSAs appeared on roughly 11% of tracked queries. By November 2025, that number rose to 31%. The paid search landscape for local franchises is increasingly LSA-driven, and franchise systems not investing in this channel are losing prime placement.
Many franchise systems operate on a 70/30 digital-to-local marketing ratio. Industry practitioners recommend moving closer to a 60/40 ratio — reducing over-reliance on pure digital spend and increasing grassroots and community-level investment — to improve overall efficiency. The data suggests that the most effective franchise marketing combines paid digital with strong local SEO and community presence rather than treating paid ads as a standalone solution.
Source: Amra and Elma — Franchise Marketing Statistics 2025 | Scorpion — Franchise Marketing Trends
Explore BizIQ’s Google Ads Management for Franchise Locations
Multi-Location SEO: The Unique Challenge for Franchise Systems
Managing SEO for a single business location is complex. Managing it across 10, 50, or 500 locations introduces an entirely different category of challenge — and a correspondingly larger opportunity for franchise systems willing to invest properly.
Citation Consistency Across Franchise Locations
For multi-location franchise systems, NAP (Name, Address, Phone) consistency across online directories is both a local ranking signal and a consumer trust factor. Citation signals account for 7% of local pack ranking weight. Across a 50-location franchise system, citation inconsistency compounds: if 20% of locations have incorrect or inconsistent directory listings, that’s 10 locations actively leaking local ranking potential and confusing customers who find wrong addresses, wrong phone numbers, or mismatched business names.
One of the most common technical SEO mistakes in franchise systems is creating location pages that are near-identical copies of each other with only the city name changed. Google identifies and devalues duplicate or thin content. Every franchise location page must have genuinely unique content — local business context, area-specific service descriptions, locally relevant FAQs — to earn independent rankings. Franchise systems treating location pages as templates rather than individual content assets consistently underperform in local search.
Source: BrightLocal — Brand Beacon Report 2024 | FRANdata 2026 Franchising Economic Outlook
See BizIQ’s Multi-Location SEO Pricing and Solutions
Online Reviews and Reputation Management for Franchises
Reviews are the most visible trust signal for franchise locations in local search. They influence rankings, drive click-through rates, and determine whether a potential customer chooses your location or a competitor’s. For franchise systems, review management at scale is a genuine operational challenge.
Review signals account for 16% of local pack ranking weight — the third-largest ranking factor. For franchise systems, this means review velocity and consistency across locations is a direct SEO input, not just a reputation consideration. Locations with fewer than 10 reviews or an average rating below 4.0 stars face a measurable conversion penalty in local search results.
74% of consumers check reviews on at least two platforms before choosing a local business. The top consumer platforms are Google (83%), Yelp (44%), and Facebook. For franchise systems, maintaining a strong presence on Google is non-negotiable, with secondary platforms playing an increasingly important role as AI tools pull review data from multiple sources to generate local recommendations.
Source: BrightLocal — Local Consumer Review Survey 2025 | Digital Applied — Local SEO Statistics 2026
Explore BizIQ’s Reputation Management Services for Franchises
Content Marketing and Social Media for Franchise Systems
Content marketing is a significant investment area for franchise systems, with 71% of franchises publishing blogs as a core channel. The strategic purpose extends beyond traffic: content builds topical authority that supports every location’s organic rankings, provides shareable material for local social media, and supports franchise recruitment by demonstrating brand expertise.
Social Media’s Role in Franchise Discovery
Social platforms are the dominant channel for franchise brand discovery: 61% of initial franchise awareness happens on Facebook and Instagram. For consumer-facing franchise locations, social media advertising builds the top-of-funnel awareness that search and local SEO then convert. The most effective franchise marketing strategies treat social as an awareness and retargeting channel — not a standalone sales channel.
Franchise content marketing serves two simultaneous audiences: the end consumer (who needs to know what your location offers and why it’s the best local option) and the potential franchisee (who needs to see brand strength, system-wide success, and operational sophistication). Content built for both audiences — local service content on location pages, thought leadership and brand content at the system level — creates a content architecture that supports both consumer acquisition and franchise development simultaneously.
Source: Amra and Elma — Franchise Marketing Statistics 2025 | HigherVisibility — Franchise Statistics 2025
Franchise Marketing Statistics Summary Table
| Statistic | Figure | Source | Year |
|---|---|---|---|
| U.S. franchise establishments (projected) | 845,000 units | IFA/FRANdata | 2026 |
| U.S. franchise economic output (projected) | $921.4 billion | IFA/FRANdata | 2026 |
| Jobs supported by U.S. franchising | 8.9 million | IFA/FRANdata | 2026 |
| New franchise businesses opening in 2026 | 12,000+ | IFA Economic Outlook | 2026 |
| Franchise GDP contribution | $558.4 billion (1.8% growth) | IFA/FRANdata | 2026 |
| Multi-unit franchisees as % of all franchisees | 19.3% | FRANdata | 2025/2026 |
| Locations controlled by multi-unit operators | 58.8% of all franchise units | FRANdata | 2025/2026 |
| New franchise leads from digital marketing | 65% | Industry survey data | 2025 |
| Franchise brand discovery via social media | 61% | Industry survey data | 2025 |
| High-value franchise leads from expos | 23% | Industry survey data | 2025 |
| Franchises allocating 40%+ budget to local SEO | 72% | Industry survey data | 2025/2026 |
| Average PPC ROI for franchise campaigns | 3.5x | Industry survey data | 2025/2026 |
| Google searches with local intent | 46% | 2026 | |
| Consumers visiting after local smartphone search | 76% within 24 hours | Google/Think with Google | 2026 |
| Local searches resulting in a purchase | 28% | Think with Google | 2026 |
| Consumers who search for local info buying within 1 week | 90% | Industry research | 2026 |
| GBP actions YoY increase | 41% | 2025–2026 | |
| GBP complete profile — more likely to attract visits | 70% more likely | 2026 | |
| GBP complete profile — more likely to be considered | 50% more likely | 2026 | |
| Marketers rating GBP management as most valuable service | 76% | Local Marketing Industry Survey | 2024/2025 |
| Consumers reading reviews before visiting local business | 87% | BrightLocal | 2026 |
| Review signals’ weight in local pack rankings | 16% | Whitespark/BrightLocal | 2025/2026 |
| Consumers checking 2+ review platforms | 74% | BrightLocal | 2025 |
| Average ChatGPT-recommended business star rating | 4.3 stars | SOCi Local Visibility Index | 2026 |
| Franchises publishing blogs as core channel | 71% | Industry survey data | 2025/2026 |
| High-performing brands with dedicated local strategy | 94% | BrightLocal Brand Beacon | 2024 |
| Multi-location marketers using generative AI | 88% | BrightLocal Brand Beacon | 2024 |
| SMBs with a Google Business Profile | Only 35% | SMB Marketing Report | 2025 |
| Local businesses matching GBP data in AI tools | Only 68% | SOCi Local Visibility Index | 2026 |
| Fastest-growing franchise sectors YoY growth rate | 3.2% (child services, residential/commercial services) | IFA/FRANdata | 2026 |
Frequently Asked Questions: Franchise Marketing Statistics
Methodology & Sources
This article was researched and written by David McGinnis, SEO Strategist at BizIQ. All statistics are sourced from Tier 1 primary sources including government agencies, major research firms, and annual industry reports with disclosed methodology. No blog-to-blog citations are used. Sources include:
- International Franchise Association (IFA) / FRANdata — 2026 Franchising Economic Outlook: Annual forecast tracking approximately 9,000 U.S. franchise brands across all 50 states. Published February 2026.
- BrightLocal — Local Consumer Review Survey 2025 / Brand Beacon Report 2024 / Local SEO Statistics 2026: Annual primary research on consumer local search behavior and local marketing industry benchmarks.
- Google / Think with Google: Primary search behavior data including local intent percentages, near-me search conversion rates, and GBP performance data.
- SOCi — Local Visibility Index 2026: Primary research on AI local search behavior, GBP data accuracy in AI tools, and multi-location brand performance.
- Whitespark — Local Search Ranking Factors 2025: Annual expert survey identifying weighted local ranking factors for Google Local Pack and organic local results.
- Reshift Media — 2026 Franchise Development Trends Report: Proprietary analysis of franchise search trend data and digital advertising performance metrics across hundreds of franchise campaigns.
- HigherVisibility — Franchise Statistics 2025: Aggregated franchise marketing data with primary source attribution.
Statistics without a named Tier 1 source reflect industry survey data from multiple sources with consistent reporting. BizIQ Analysis calculations are original to BizIQ and clearly labeled as such.
Get a Free Franchise SEO Consultation