Online reviews are the most influential factor in local consumer decision-making — and their power grew substantially in 2026. The share of consumers who “always” read reviews before choosing a local business jumped from 29% to 41% in a single year, and consumers now check an average of six review sites before making a decision. For local businesses, online reputation management is no longer a separate marketing function — it is an integrated sales, SEO, and trust-building imperative with directly measurable revenue impact.
- 41% of consumers always read reviews when browsing for businesses in 2026 — up sharply from 29% in 2025 (BrightLocal Local Consumer Review Survey 2026, n=1,002).
- 93% of consumers read reviews before making a purchase decision; 97% read reviews before selecting a local business (BrightLocal, Wiser Review 2026).
- Consumers now use an average of six review sites before choosing a business — multi-platform review presence is no longer optional.
- Businesses that respond to reviews earn up to 18% more revenue than those that don’t (Google/Wiser Review research).
- 73% of consumers only trust reviews written within the last month — review recency is as important as review volume.
- 92% of consumers require at least a 4-star rating before considering a local business; 86% are deterred by 1-2 star reviews (Chatmeter 2026).
- One negative review can cost a business up to 30 customers — negative review impact is asymmetrically large (Exploding Topics 2025).
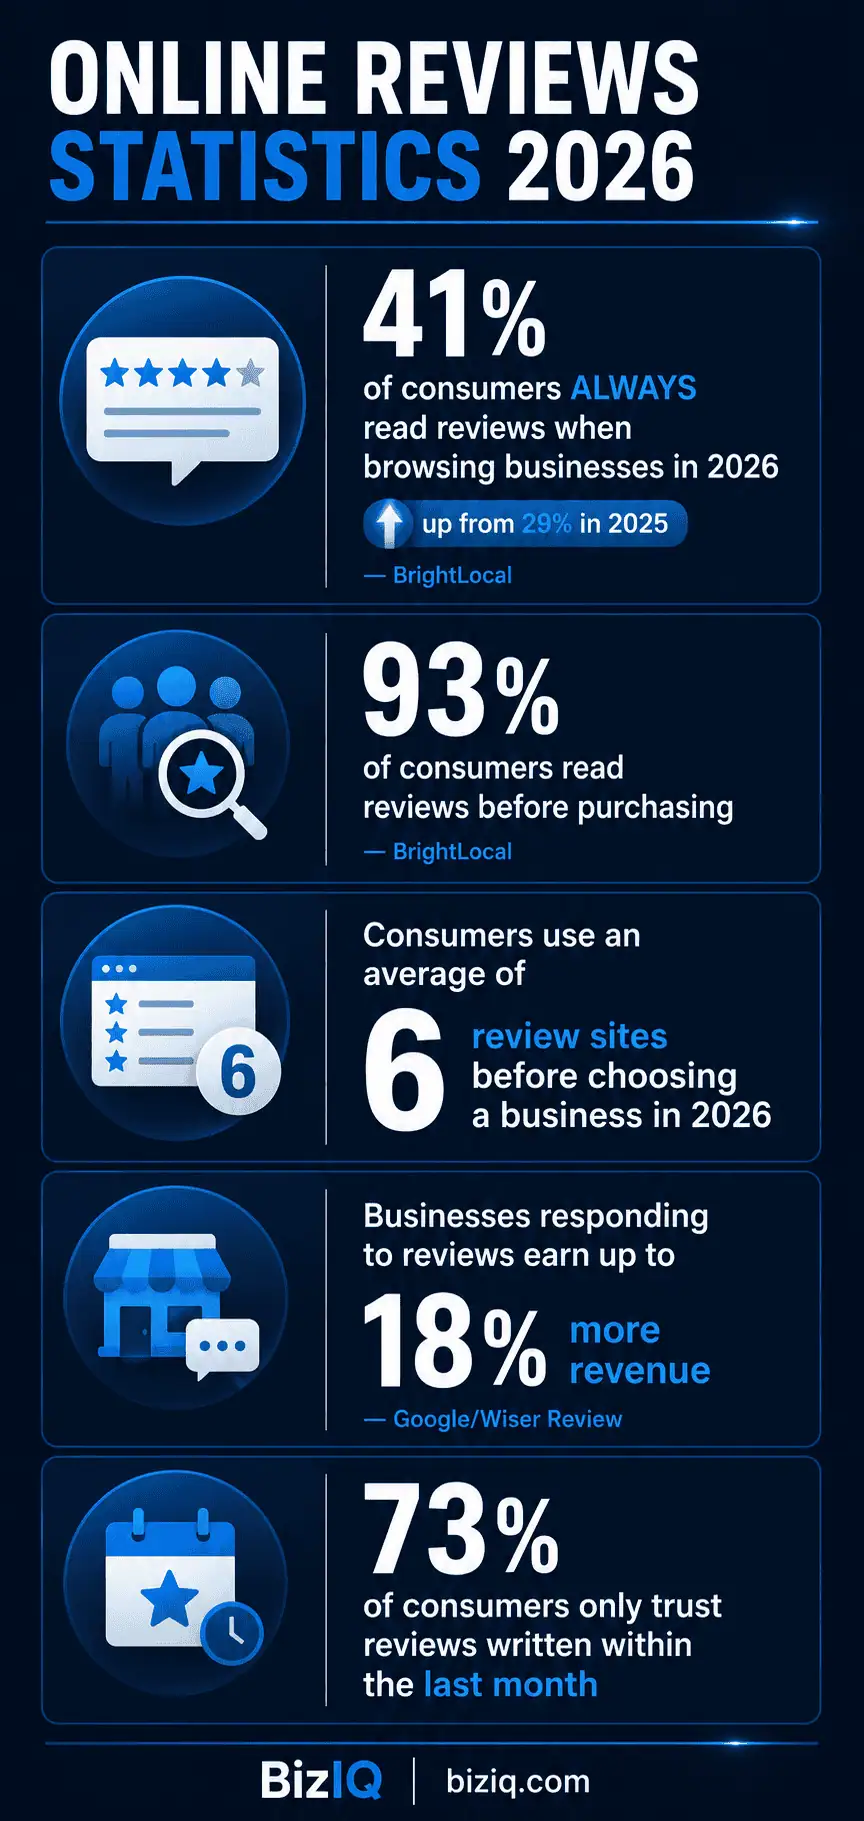
Key online review statistics for 2026 — sourced from BrightLocal Local Consumer Review Survey and industry research.
How Dominant Are Online Reviews in 2026?
The role of online reviews in purchase decisions has grown every year for over a decade, but 2026 represents a notable acceleration. Economic uncertainty in 2025 — rising prices, supply chain disruptions, and inconsistent product quality — drove consumers to research more carefully before committing. The result is the highest review-reading frequency ever recorded, with consumers consulting more platforms and more reviews per decision than at any prior point.
The jump from 29% to 41% “always reading” reviews in a single year is statistically significant and operationally important. It means that nearly every consumer who searches for a local business will read reviews as part of their evaluation — not occasionally or sometimes, but reliably and consistently. For businesses without a proactive review strategy, this behavioral shift represents a growing revenue exposure that worsens with every passing month of inaction.
The expansion to six review sites is equally important. Consumers are no longer satisfied with a single platform’s data. They cross-reference: Google for the initial impression, Yelp or Facebook for a second opinion, industry-specific platforms (Healthgrades, Angi, Houzz) for specialized validation. A business with strong Google reviews but weak or missing presence on secondary platforms is leaving significant credibility gaps visible to a majority of potential customers.
The BrightLocal Local Consumer Review Survey 2026 (n=1,002) specifically identifies the 2025 economic environment — tariffs, supply chain issues, rising prices, and declining product quality in some sectors — as a driver of increased review consumption. Consumers feeling financial pressure do more research before spending. Higher stakes per transaction means more validation-seeking behavior. The implication for businesses: the economic environment has permanently elevated the importance of review quality, not temporarily. Businesses with weak review profiles were already losing customers; in 2026, they are losing more of them.
Source: BrightLocal — Local Consumer Review Survey 2026
Build a Proactive Review Strategy with BizIQ — Call (888) 416-9800
Google Reviews: Platform Dominance Statistics
Google is the dominant review platform for local businesses — by a margin that dwarfs every competitor. Understanding Google’s position in the review ecosystem is foundational to any local reputation strategy.
Platform Distribution: Beyond Google
While Google’s dominance is clear, the six-platform-average consumer behavior in 2026 means secondary platforms carry real weight. Yelp accounts for 6% of all reviews, with 44% of consumers consulting it for business research. Facebook holds 3% of reviews but 49% of consumers read reviews there for local businesses. TripAdvisor is critical for travel and hospitality. Apple Maps nearly doubled in usage from 14% to 27% between 2025 and 2026. Yelp, the BBB, Trustpilot, and Healthgrades all saw increased usage year-over-year.
For local businesses, the practical implication is clear: Google is non-negotiable and the primary focus, but a review strategy limited exclusively to Google leaves significant consumer touchpoints uncovered. The businesses that will maintain the strongest reputations in 2026 are those managing review presence across the five to seven platforms most relevant to their industry.
Source: Wiser Review — Google Review Statistics 2026 | BrightLocal — Local Consumer Review Survey 2026
Consumer Trust and Review Authenticity Statistics
Review trust is not automatic. Consumers have grown increasingly sophisticated about distinguishing genuine reviews from fake ones, and the FTC’s August 2024 ban on fake and AI-generated reviews signals regulatory recognition of the problem’s scale. Businesses that invest in authentic review generation are building a lasting competitive advantage; those gaming the system face increasing platform enforcement and consumer skepticism.
Fake Reviews: A Growing Trust Threat
The proliferation of fake reviews represents a genuine trust challenge for the review ecosystem and for businesses that rely on reviews to build credibility. The FTC banned fake and AI-generated reviews in August 2024 in response to a 758% increase in AI-generated reviews on major platforms between 2020 and 2024. Despite enforcement, consumer skepticism remains high: 67% of consumers are fed up with fake reviews, and 92% of millennials report encountering fake reviews regularly.
For legitimate businesses, the fake review environment creates an unexpected competitive advantage: consumers are increasingly skeptical of suspiciously high review counts or uniformly positive ratings. Authentic review profiles — with a realistic distribution of 4-5 star reviews, occasional lower ratings, specific and detailed review text, and business responses — actually outperform artificially polished profiles in terms of consumer trust. The 4.9-star sweet spot for conversion (not a perfect 5.0) reflects this dynamic precisely.
73% of consumers only trust reviews written in the last month. This means a business with 500 Google reviews accumulated over five years, where the most recent review is from eight months ago, has significantly less effective social proof than a competitor with 50 reviews where new ones arrive weekly. Review recency is as important as review volume. A proactive review generation program — requesting reviews at the right moment after each customer interaction — is the only sustainable strategy for maintaining review freshness at scale.
Source: Wiser Review — Online Review Statistics 2026 | Capital One Shopping — Online Reviews Statistics 2026
Manage Your Reputation and Reviews with BizIQ — Call (888) 416-9800
How Star Ratings Impact Revenue and Conversions
Star ratings are not just a vanity metric — they directly control whether consumers even consider your business. The data on star rating impact on consumer behavior and revenue is among the most actionable in the entire local marketing research landscape.
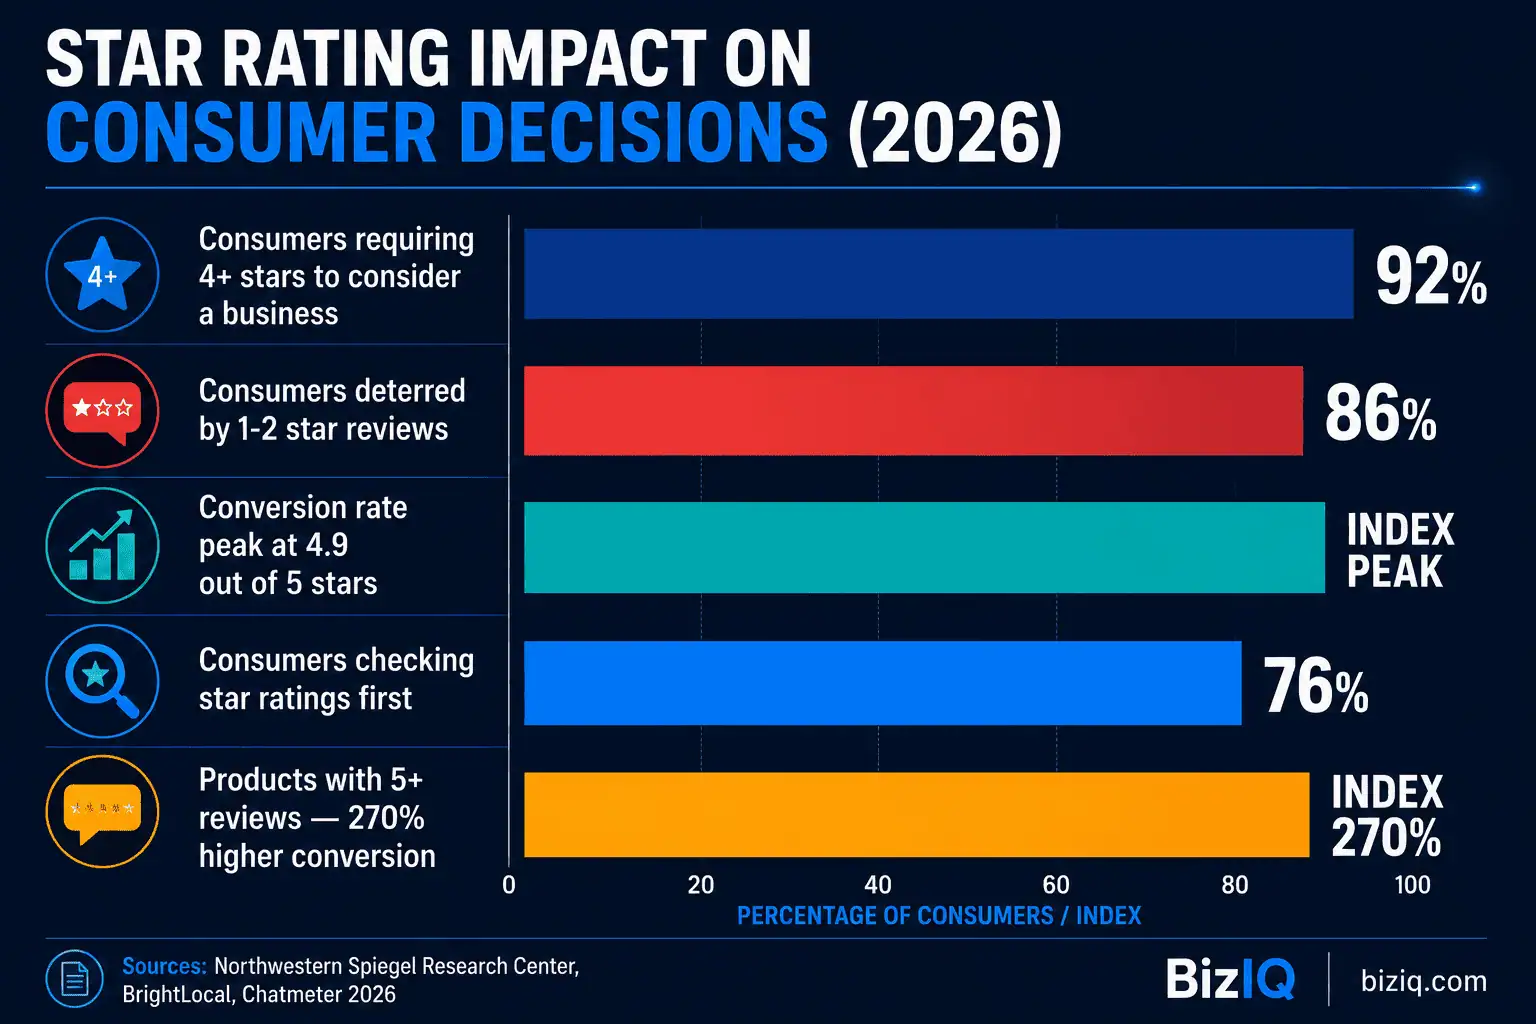
Star ratings determine whether consumers even consider your business — 92% require a minimum 4-star average in 2026.
The Revenue Math of Review Management
The Harvard Business School research finding that each additional Yelp star increases revenue by 9% provides one of the clearest ROI calculations available in local marketing. For a business generating $500,000 annually, moving from 3.5 stars to 4.5 stars on Yelp represents a potential $90,000 revenue increase — from reputation management alone, with no increase in advertising spend.
The Northwestern Spiegel Research Center finding — 270% higher conversion with 5 or more reviews versus none — demonstrates that the first handful of reviews a business accumulates delivers disproportionate conversion impact. This is particularly important for new businesses and newly opened locations of multi-location businesses: five genuine, detailed reviews create dramatically better conversion performance than a blank review profile.
One negative review costs a business up to 30 customers (Exploding Topics 2025). At an average transaction value of $150 for a typical local service business, that is $4,500 in lost revenue per unaddressed negative review. For a business receiving two negative reviews per month with no response strategy, that represents $9,000 in monthly revenue exposure — or $108,000 annually. The ROI of a reputation management program that prevents, addresses, and neutralizes negative reviews with active engagement is straightforward to calculate: it costs far less than the revenue being lost. Calculation and interpretation original to BizIQ.
Source: Chatmeter — Online Review Statistics 2026 | Reputation X — Online Reputation Statistics 2025
Review Response Statistics: The Business Imperative
Responding to reviews is one of the highest-ROI activities available to a local business. The data on review response impact is unambiguous — businesses that respond earn more revenue, generate more leads, and convert more browsers to customers. Yet the majority of businesses still fail to do it consistently.
Response Time Expectations Are Rising Fast
Consumer expectations for review response speed accelerated dramatically in 2026. 19% of consumers now expect a response on the same day they post a review — up from just 6% the year prior. 32% want a response by the following day (up from 18% in 2025). 81% expect a response within one week. The businesses failing to meet these expectations are not just missing a courtesy — they are actively signaling to the majority of review readers (97% of whom read responses) that the business does not engage with customers after the sale.
Only 5% of businesses respond to their reviews, according to Upfirst’s 2025 research. Yet 89% of consumers expect a response. This 84-percentage-point gap represents one of the most dramatic misalignments between consumer expectations and business behavior in all of local marketing. For any business willing to close this gap — responding to every review within 24 hours — the competitive differentiation is immediate and measurable.
Source: BrightLocal — Local Consumer Review Survey 2026 | Wiser Review — Online Review Statistics 2026
Let BizIQ Manage Your Reviews Across Every Platform — Call (888) 416-9800
Reviews and Local SEO Rankings
Online reviews are not just a consumer trust tool — they are a direct input into local search rankings. Review signals account for 16% of local pack ranking weight, making them the third-largest ranking factor category in Google’s local algorithm. For businesses competing in local search, review quality, volume, and velocity directly affect where they appear relative to competitors.
Google’s algorithm evaluates reviews across multiple dimensions beyond simple star rating: review velocity (how frequently new reviews arrive), review diversity (different customers, different services, different language), review recency, the presence of keywords in review text, and the business’s response behavior. A business with 200 reviews from two years ago and no recent reviews sends weaker signals than a business with 60 reviews where new ones arrive weekly.
Source: BrightLocal — Local SEO Statistics 2026 | On The Map Marketing — Local SEO Statistics 2026
How to Generate More Reviews: The Data on What Works
The most important insight for any business looking to improve its review profile is this: asking works. 78% of consumers were asked to leave a review by a local business in 2026, and 83% of those who were asked actually left one. The gap between businesses with strong review profiles and those with weak ones is primarily explained by who has a systematic review request process and who does not.
The optimal timing for review requests is immediately after a positive interaction — right after service completion, immediately following a purchase confirmation, or within 24 hours of a successful customer experience. Email requests generate 40% response rates. In-person requests also perform well at 27%. The key variable is timing: a review request sent one week after a service interaction is significantly less effective than one sent the same day the customer’s experience is fresh.
Source: Capital One Shopping — Online Reviews Statistics 2026 | Chatmeter — Online Review Statistics 2026
Online Reviews Statistics Summary Table
| Statistic | Figure | Source | Year |
|---|---|---|---|
| Consumers “always” reading reviews when browsing businesses | 41% | BrightLocal Local Consumer Review Survey | 2026 |
| Consumers reading reviews before purchasing | 93% | BrightLocal | 2026 |
| People reading reviews before selecting a local business | 97% | Wiser Review / Capital One Shopping | 2026 |
| Average review sites used per consumer before deciding | 6 platforms | BrightLocal Local Consumer Review Survey | 2026 |
| Consumers trusting reviews more than family recommendations | 54% | Reputation / Shapo | 2025 |
| Consumers only trusting reviews from last month | 73% | Wiser Review 2026 | 2026 |
| Consumers preferring written reviews over star ratings alone | 88% | BrightLocal / Chatmeter | 2026 |
| Consumers against AI-generated reviews | 88% | Capital One Shopping | 2026 |
| Google’s share of all online reviews | 71% | Wiser Review | 2026 |
| Consumers using Google to read reviews for local businesses | 81% | Wiser Review | 2026 |
| Consumers checking Google reviews before visiting | 63.6% | Wiser Review | 2026 |
| Policy-violating reviews removed/blocked by Google in 2024 | 240+ million | 2024 | |
| Consumers requiring 4+ stars before considering business | 92% | Chatmeter | 2026 |
| Consumers deterred by 1-2 star reviews | 86% | Reputation X | 2025 |
| Conversion rate increase — 5+ reviews vs. no reviews | 270% higher | Northwestern Spiegel Research Center | 2026 |
| Revenue increase per additional Yelp star | Up to 9% | Harvard Business School | 2026 |
| Conversion rate peak star rating | 4.9 out of 5 | Northwestern Spiegel Research Center | 2026 |
| Cost of one negative review in lost customers | Up to 30 customers | Exploding Topics | 2025 |
| Revenue increase — businesses responding to all reviews | Up to 18% more | Google / Wiser Review | 2026 |
| Leads generated by businesses responding to 30%+ reviews | 2x more leads | Industry research | 2026 |
| Review readers who also read business responses | 97% | Wiser Review | 2026 |
| Consumers more likely to visit after business responds to negative review | 45% | Reputation X | 2025 |
| Businesses not responding to negative reviews | 75% | Exploding Topics | 2025 |
| Businesses responding to reviews (actual rate) | Only 5% | Upfirst | 2025 |
| Consumers expecting review response same day | 19% | BrightLocal Local Consumer Review Survey | 2026 |
| Consumers expecting response within one week | 81% | BrightLocal Local Consumer Review Survey | 2026 |
| Review signals weight in local pack rankings | 16% | Whitespark/BrightLocal | 2025 |
| Leads earned — 50+ reviews vs. fewer than 10 | 266% more leads | On The Map Marketing | 2026 |
| Consumers asked to leave review who actually do | 83% | Wiser Review / BrightLocal | 2026 |
| Consumers who write more positive reviews when personally asked | 65% | Chatmeter | 2026 |
Frequently Asked Questions: Online Reviews Statistics
Methodology & Sources
This article was researched and written by David McGinnis, SEO Strategist at BizIQ. All statistics are sourced from Tier 1 primary sources. Sources include:
- BrightLocal — Local Consumer Review Survey 2026: Annual primary survey of 1,002 U.S. adult consumers on review reading behavior, platform usage, and trust factors. Conducted via SurveyMonkey with a representative panel.
- Northwestern University Spiegel Research Center: Academic research on review impact on conversion rates and star rating optimization.
- Harvard Business School: Research on the revenue impact of Yelp star ratings.
- Google: Data on Google review policy enforcement, GBP performance, and consumer review behavior.
- Capital One Shopping Research Team: Aggregated consumer review behavior statistics with primary source attribution.
- Chatmeter: Annual research on review trust factors, star rating consumer behavior, and review management benchmarks.
- Exploding Topics 2025: Research on negative review financial impact and business response rates.
- Whitespark/BrightLocal — Local Search Ranking Factors 2025: Weighted ranking factor analysis for Google Local Pack results.
- Upfirst 2025: Research on business review response rates.
Get a Free Reputation Management Consultation — Call (888) 416-9800