
Content marketing delivers $7.65 for every $1 invested — compared to $1.80 for paid advertising. Companies with active blogs generate 67% more leads per month than those without one. Organizations with a documented content strategy generate 3x more leads per dollar than those winging it. The content marketing data for 2026 is unambiguous: content is the highest-ROI owned marketing channel available to most businesses, the gap between strategic and non-strategic execution is enormous, and AI has fundamentally changed the economics of production. This is the full data picture.
- Average content marketing ROI is $7.65 per $1 spent in 2026 — vs. $1.80 per dollar for paid advertising, a 67% performance advantage (Revenue Memo 2026).
- Content marketing costs 62% less than traditional advertising while generating 3x more leads — the most cited efficiency benchmark in content marketing research (Demand Metric).
- Organizations with documented content strategies generate 3x more leads per dollar than those without — yet 27% of B2C marketers still lack a documented strategy (Digital Applied 2026 / CMI).
- Companies with active blogs generate 67% more leads per month and 55% more website traffic than non-blogging competitors (OmniBound 2026 / Firework).
- Short-form video is the highest-ROI content format in 2026 — 104% more marketers named it their top channel in 2025 vs. the prior year (KLIQ Interactive / HubSpot State of Marketing).
- 86% of marketers plan to increase research and original content budgets in 2026 — those publishing original data report 64% higher conversion rates and 61% stronger SEO performance (Typeface / CMI B2B Report).
- AI adoption has cut content production costs 68% for enterprise users — 68% of businesses report increased content ROI as a direct result of AI use (Revenue Memo 2026).
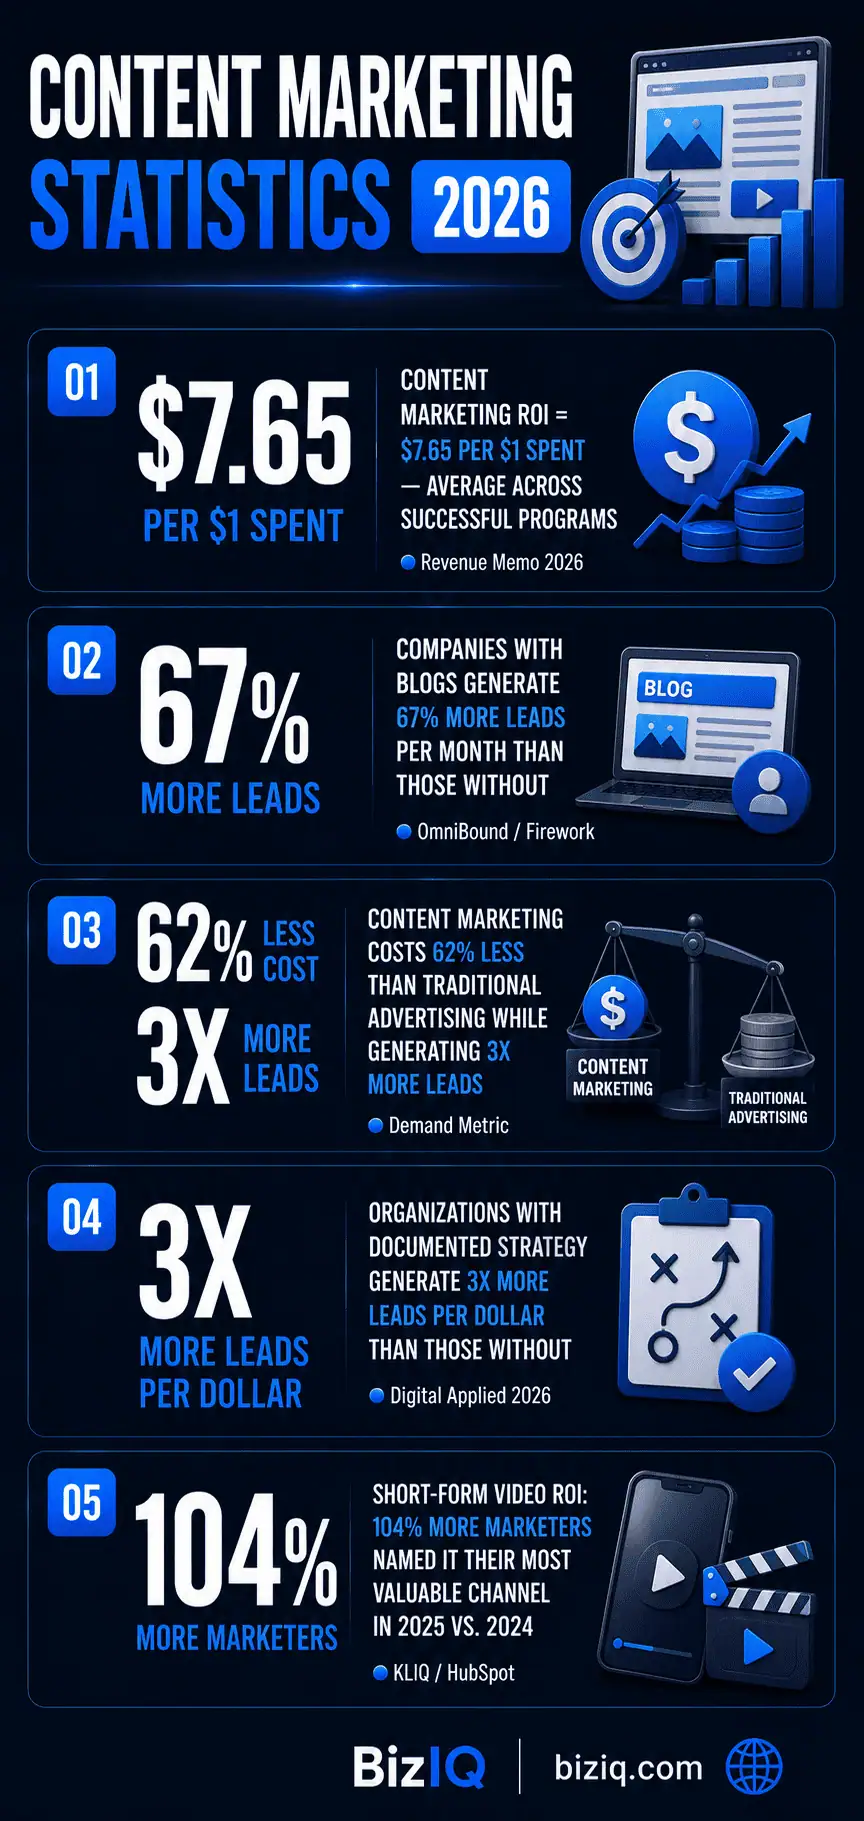
Key content marketing statistics for 2026 — ROI benchmarks, blogging impact, cost efficiency, and video dominance.
Content Marketing Market Size and Investment (2026)
Content marketing has crossed from experimental channel to core business function in 2026. The market data reflects a discipline that has reached maturity in adoption while continuing to grow rapidly in investment, as the compounding economics of owned content assets drive sustained budget increases even in constrained environments.
The 26% budget allocation to content reflects a structural shift in how marketing organizations think about spend. Unlike paid media — which produces results proportional to continuous investment — content assets appreciate over time. A blog post published today continues generating organic traffic and leads for an average of 3.5 years after publication without additional spend. This compounding dynamic explains why content marketing budgets have grown consistently for five consecutive years and why the market shows no sign of deceleration.
Source: Revenue Memo — Content Marketing ROI Statistics 2026 | Digital Applied — Content Marketing Statistics 2026
Build a Content Marketing Strategy That Compounds — Call (888) 416-9800
Content Marketing ROI Benchmarks (2026)
The ROI case for content marketing is now one of the most thoroughly documented in all of digital marketing. Multiple independent research streams consistently show content outperforming paid channels by a substantial margin — and the advantage compounds over time.
Why the ROI Gap Between Content and Paid Is Widening
The 67% performance advantage of content marketing over paid advertising ($3 vs. $1.80 per dollar) understates the true gap for established programs. The calculation above represents point-in-time returns — but content’s compounding return structure means a program in year three produces dramatically higher returns than year one on the same dollar of content investment. A piece of content that drives 100 organic leads in its first year may drive 250 leads in year three as it accumulates backlinks, gains ranking authority, and attracts AI citations — all without additional investment. Paid advertising returns in year three are identical to year one: whatever the budget produces at that moment’s CPC and conversion rate, with nothing banked from prior years.
For a business investing $2,000/month in content marketing vs. $2,000/month in paid advertising: Year 1 content return at $3/$1 = $6,000/month. Year 3 content return, assuming a conservative 2x compounding effect from accumulated SEO authority and backlinks, = approximately $12,000/month from the same content investment. Year 3 paid advertising return remains $3,600/month (at $1.80/$1 — unchanged). The 3-year cumulative gap between content and paid advertising, assuming identical monthly investment, grows from $2,400/month in year one to approximately $8,400/month in year three. This calculation explains why the most successful small business marketing operations in 2026 invest simultaneously in both — paid for immediate lead flow, content for compounding long-term equity. Calculation original to BizIQ based on published ROI benchmarks; actual results vary by industry, market, and execution quality.
Source: Revenue Memo — Content Marketing ROI Statistics 2026 | GenesysGrowth — Content Marketing ROI Statistics 2026
Blogging Statistics (2026)
Business blogging remains the most accessible and highest-compounding content marketing activity for local and mid-size businesses. The performance data for companies that blog consistently vs. those that don’t is among the most consistent findings in content marketing research.
What Makes a Blog Drive Business Results vs. Traffic Alone
The 67% more leads statistic does not apply equally to all business blogs. The gap between blogs that generate business results and those that generate traffic without conversion traces to three consistent differences: (1) topic selection aligned with commercial intent, not just search volume — the most effective business blogs target readers at or near purchase intent rather than purely informational queries; (2) conversion infrastructure on the blog — CTA placement, email capture, and internal links to service pages that convert traffic into leads rather than readers who leave without acting; (3) publishing consistency — the 13x ROI advantage of consistent blogging vs. sporadic publishing confirms that irregular content production fails to build the authority signals and content volume that drive compounding organic performance.
Source: OmniBound — B2B Content Marketing Statistics 2026 | Siege Media — Content Marketing Statistics 2026
Optimize Your Content for Search and Leads — Call (888) 416-9800
Video Marketing Statistics (2026)
Video has moved from an optional content investment to the dominant format by ROI and adoption. The 2026 data shows near-universal adoption among marketing teams and consistent, measurable performance advantages across brand awareness, lead generation, and direct sales conversion.
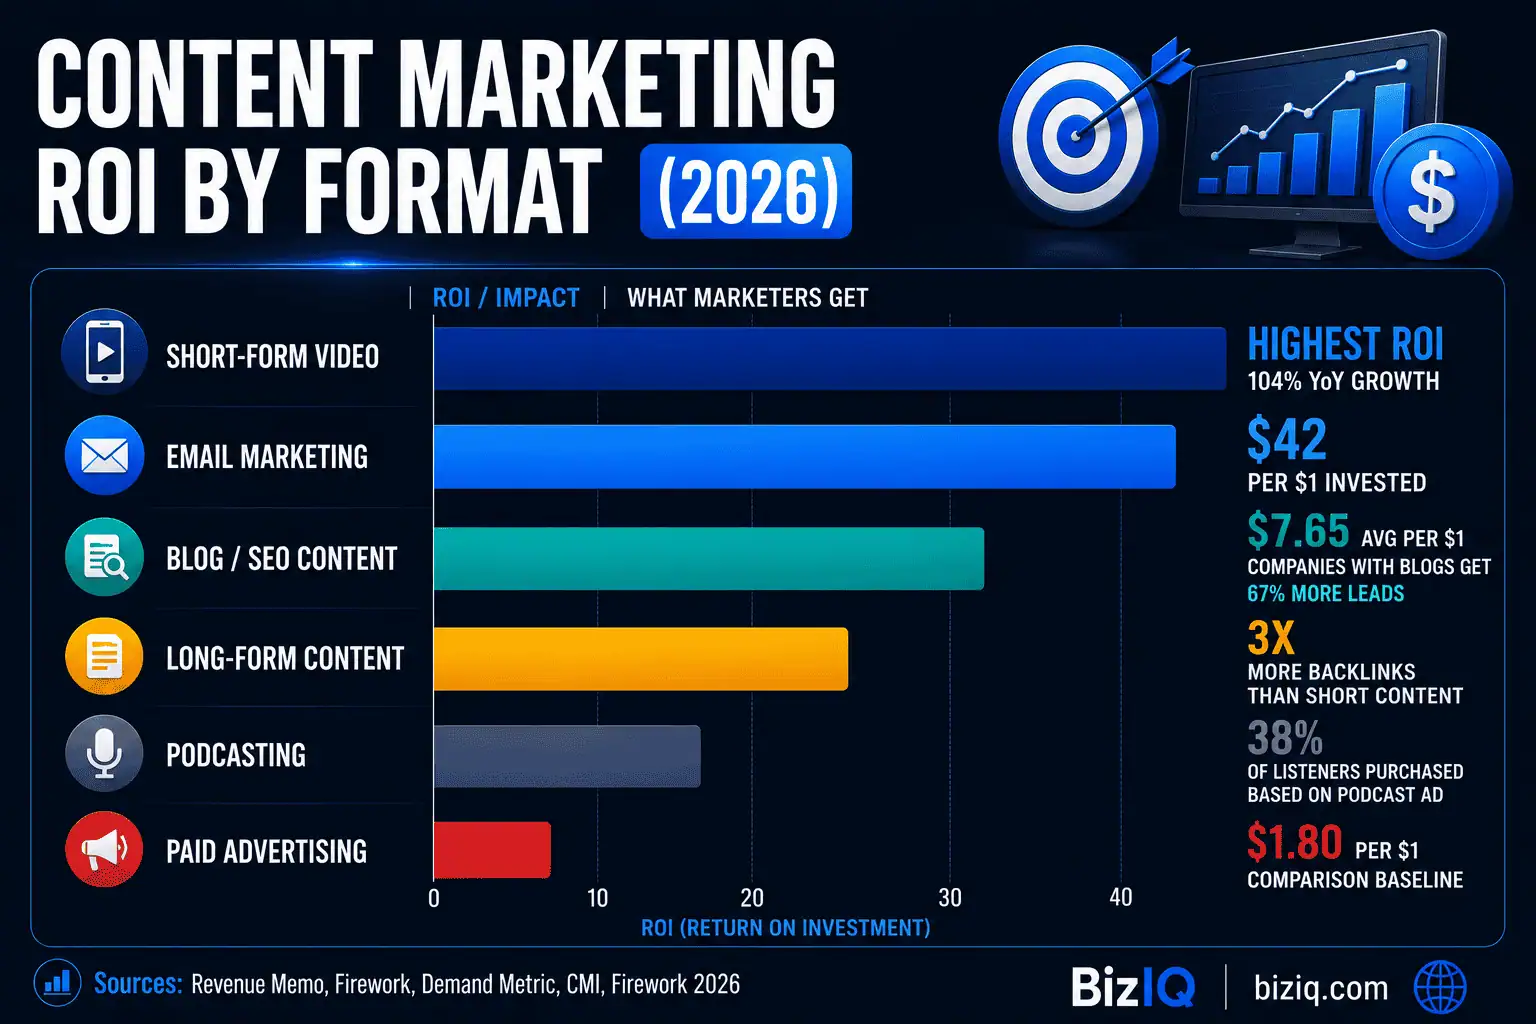
Content marketing ROI by format in 2026 — short-form video and email top the charts; paid advertising lags behind content channels.
Short-Form vs. Long-Form Video in 2026
Short-form video (under 60 seconds on TikTok, Instagram Reels, YouTube Shorts, and LinkedIn) delivers the highest ROI among all video formats in 2026 — with 104% more marketers rating it their top channel compared to the prior year. Long-form video (YouTube, webinars, product demonstrations) delivers a different value: longer dwell time, higher educational value for complex products and services, and stronger influence on high-consideration purchase decisions. For local service businesses, the practical format hierarchy is: short-form social video for brand awareness and discovery, long-form YouTube for service explanations and trust-building, and video testimonials for conversion at the decision stage. LinkedIn video watch time grew 36% year-over-year in 2025 — making it a particularly high-priority platform for B2B local service providers.
Source: KLIQ Interactive — B2B Marketing Benchmarks 2025–2026 | Revenue Memo — B2C Content Marketing Statistics 2026
Build Your Video Content Strategy with BizIQ — Call (888) 416-9800
Content Strategy vs. No Strategy: The Performance Gap
The single most consistent finding across content marketing research in 2026 is the performance gap between organizations with a documented content strategy and those without. The documentation effect is large, consistent across B2B and B2C, and holds even when controlling for budget levels.
What a Documented Content Strategy Includes
A documented content strategy, as defined by the Content Marketing Institute’s annual B2B research (survey of 1,015 B2B marketers, fielded June–August 2025), includes: a written definition of the target audience and their key questions at each stage of the buying journey; clear channel and format priorities based on audience research rather than trend adoption; a publishing calendar with realistic cadence commitments; defined conversion goals and measurement frameworks for each content type; and a process for content distribution that extends the reach of each published piece beyond organic search alone. Organizations that have all five components in place generate substantially more leads per dollar than those with partial or undocumented approaches.
Despite the well-documented 3x performance advantage of documented strategy, 66.5% of content marketers still struggle to know where to allocate resources (Siege Media + Wynter 2026). The top two content marketing frustrations in 2025 were getting content to rank (77.6% of marketers) and meeting user/search intent (70.6%). Both frustrations are symptoms of missing strategic clarity — not production capability. Businesses that invest in AI tools or increased content volume without first resolving strategic uncertainty typically see diminishing returns from higher output.
Source: Content Marketing Institute — B2B Content Marketing Research 2025 | Siege Media — Content Marketing Statistics 2026
AI in Content Marketing (2026)
AI has fundamentally restructured the economics of content marketing. The cost of production has collapsed. The quality bar set by search engines and AI-driven discovery has risen. The organizations that are capturing AI’s benefits are those using it to produce better content faster — not those using it to produce more mediocre content at scale.
The most significant AI-driven trend in content marketing for 2026 is the simultaneous collapse of production costs and the rise of original research as a differentiator. As AI makes it trivially easy to produce competent generic content at scale, the content that drives citations, backlinks, and AI visibility is original data — surveys, proprietary analyses, client aggregate studies, and first-party research that no competitor can replicate from a prompt. The 86% of marketers increasing research budgets in 2026 are making a strategic bet: that as generic AI content floods the internet, original insight becomes the scarcest and most valuable form of content.
Source: Typeface — Content Marketing Statistics 2026 | Revenue Memo — Content Marketing ROI Statistics 2026
Get a Content Marketing Strategy Built for ROI — Call (888) 416-9800
Content Marketing Statistics Summary Table
| Statistic | Figure | Source | Year |
|---|---|---|---|
| Worldwide content marketing revenue | $107.5 billion | Revenue Memo | 2026 |
| Content marketing CAGR | 13.53% | Revenue Memo | 2026 |
| Content marketing share of total marketing spend | 26% | Revenue Memo / Digital Applied | 2026 |
| B2B marketers using content marketing | 92% | Digital Marketing Institute / Taboola | 2026 |
| B2B marketers with documented content strategy | 73% | Digital Applied / CMI | 2026 |
| B2C marketers with documented content strategy | 70% | Digital Applied | 2026 |
| Average content marketing ROI per $1 | $7.65 | Revenue Memo | 2026 |
| Average content marketing returns (broader benchmark) | $3.00 per $1 | Revenue Memo / GenesysGrowth | 2026 |
| Paid advertising return per $1 (baseline comparison) | $1.80 | Revenue Memo | 2026 |
| Content marketing cost advantage vs. traditional | 62% lower cost, 3x more leads | Demand Metric | 2025 |
| ROI lift — documented strategy vs. no strategy | 3x more leads per dollar | Digital Applied / CMI | 2026 |
| ROI lift — consistent blogging vs. sporadic | 13x more positive ROI | Firework / GenesysGrowth | 2026 |
| Monthly lead advantage — companies with blogs | 67% more leads | OmniBound / Firework | 2026 |
| Website traffic advantage — blogging companies | 55% more visitors | Firework / Revenue Memo | 2026 |
| Indexed pages advantage — websites with blogs | 434% more indexed pages | Revenue Memo | 2026 |
| Lead advantage — 11+ blog posts/month vs. 1/week | 5x+ more leads | Revenue Memo | 2026 |
| Blog ROI advantage for small businesses vs. average | 23% more likely to see ROI | HubSpot State of Marketing | 2026 |
| Companies using video as marketing tool | 91% | Taboola / Revenue Memo | 2026 |
| Marketers naming short-form video top channel (YoY growth) | 104% more vs. 2024 | KLIQ Interactive / HubSpot | 2025–2026 |
| Marketers reporting strong video ROI | 82% | Taboola | 2026 |
| Video increases brand awareness | 93% | Taboola | 2026 |
| Consumers influenced by video before buying | 85% | Revenue Memo | 2026 |
| Video ROI speed advantage vs. written content | 49% faster | GenesysGrowth / Firework | 2026 |
| LinkedIn video watch time growth | 36% YoY | KLIQ Interactive | 2025 |
| Conversion rate advantage — original research publishers | 64% higher | Typeface / CMI | 2026 |
| SEO performance lift — original data publishers | 61% stronger | Typeface / CMI | 2026 |
| Marketers using AI in content creation | 94–95% | Taboola / Typeface | 2026 |
| Enterprise content production cost reduction from AI | 68% lower | Revenue Memo | 2026 |
| Businesses reporting increased ROI from AI content use | 68% | Revenue Memo | 2026 |
| ROI lift — AI adoption + measurement vs. AI without measurement | 2.4x better | Revenue Memo | 2026 |
| Marketers increasing research/original content budgets | 86% | Typeface / CMI | 2026 |
| Email marketing ROI (content distribution) | $42 per $1 | Firework / Siege Media | 2026 |
| Branded podcasts — purchase conversion | 38% of listeners purchased | Revenue Memo | 2026 |
| Content marketers struggling with resource allocation | 66.5% | Siege Media + Wynter | 2026 |
Frequently Asked Questions: Content Marketing Statistics 2026
Methodology & Sources
This article was researched and written by David McGinnis, SEO Strategist at BizIQ. All statistics are sourced from Tier 1 primary sources. Sources include:
- Content Marketing Institute (CMI) — B2B Content Marketing Benchmarks, Budgets, and Trends: Outlook for 2025: Annual primary research. Survey of 1,015 B2B marketers, fielded June–August 2025. North America primary with global representation.
- HubSpot — State of Marketing 2026: Annual survey of 1,500+ global marketers on channel ROI, format performance, and AI adoption.
- Demand Metric: Content marketing cost efficiency vs. traditional advertising research (62% lower cost / 3x leads benchmark).
- Revenue Memo — Content Marketing ROI Statistics 2026 / B2C Content Marketing Statistics 2026: Comprehensive aggregation of primary content marketing ROI data with source attribution.
- Siege Media + Wynter 2026: Annual content marketer survey on challenges, frustrations, and strategy maturity.
- Firework / GenesysGrowth: Blogging performance benchmarks, video ROI speed data, and content marketing ROI statistics.
- KLIQ Interactive — B2B Marketing Benchmarks 2025–2026: Short-form video adoption and ROI data, LinkedIn video performance benchmarks.
- OmniBound — B2B Content Marketing Statistics 2026: Blog lead generation benchmarks and B2B content performance data with primary source attribution.
- Typeface — Content Marketing Statistics 2026: AI adoption in content workflows, original research ROI impact data.
- Taboola — 2026 Content Marketing Statistics: Video marketing adoption and ROI benchmarks.
BizIQ Analysis calculations are original to BizIQ and clearly labeled as such.
Build a Content Program That Compounds — Call (888) 416-9800