Forty-six percent of all Google searches have local intent. That single statistic explains why local SEO is the most direct revenue driver available to a small business — and why the businesses that rank in the Local 3-Pack in 2026 are winning customers that competitors never even see. This article compiles 85 verified local SEO statistics from Tier 1 primary sources, covering everything from Google Business Profile performance to mobile search behavior to the hard ROI data that makes the investment decision obvious.
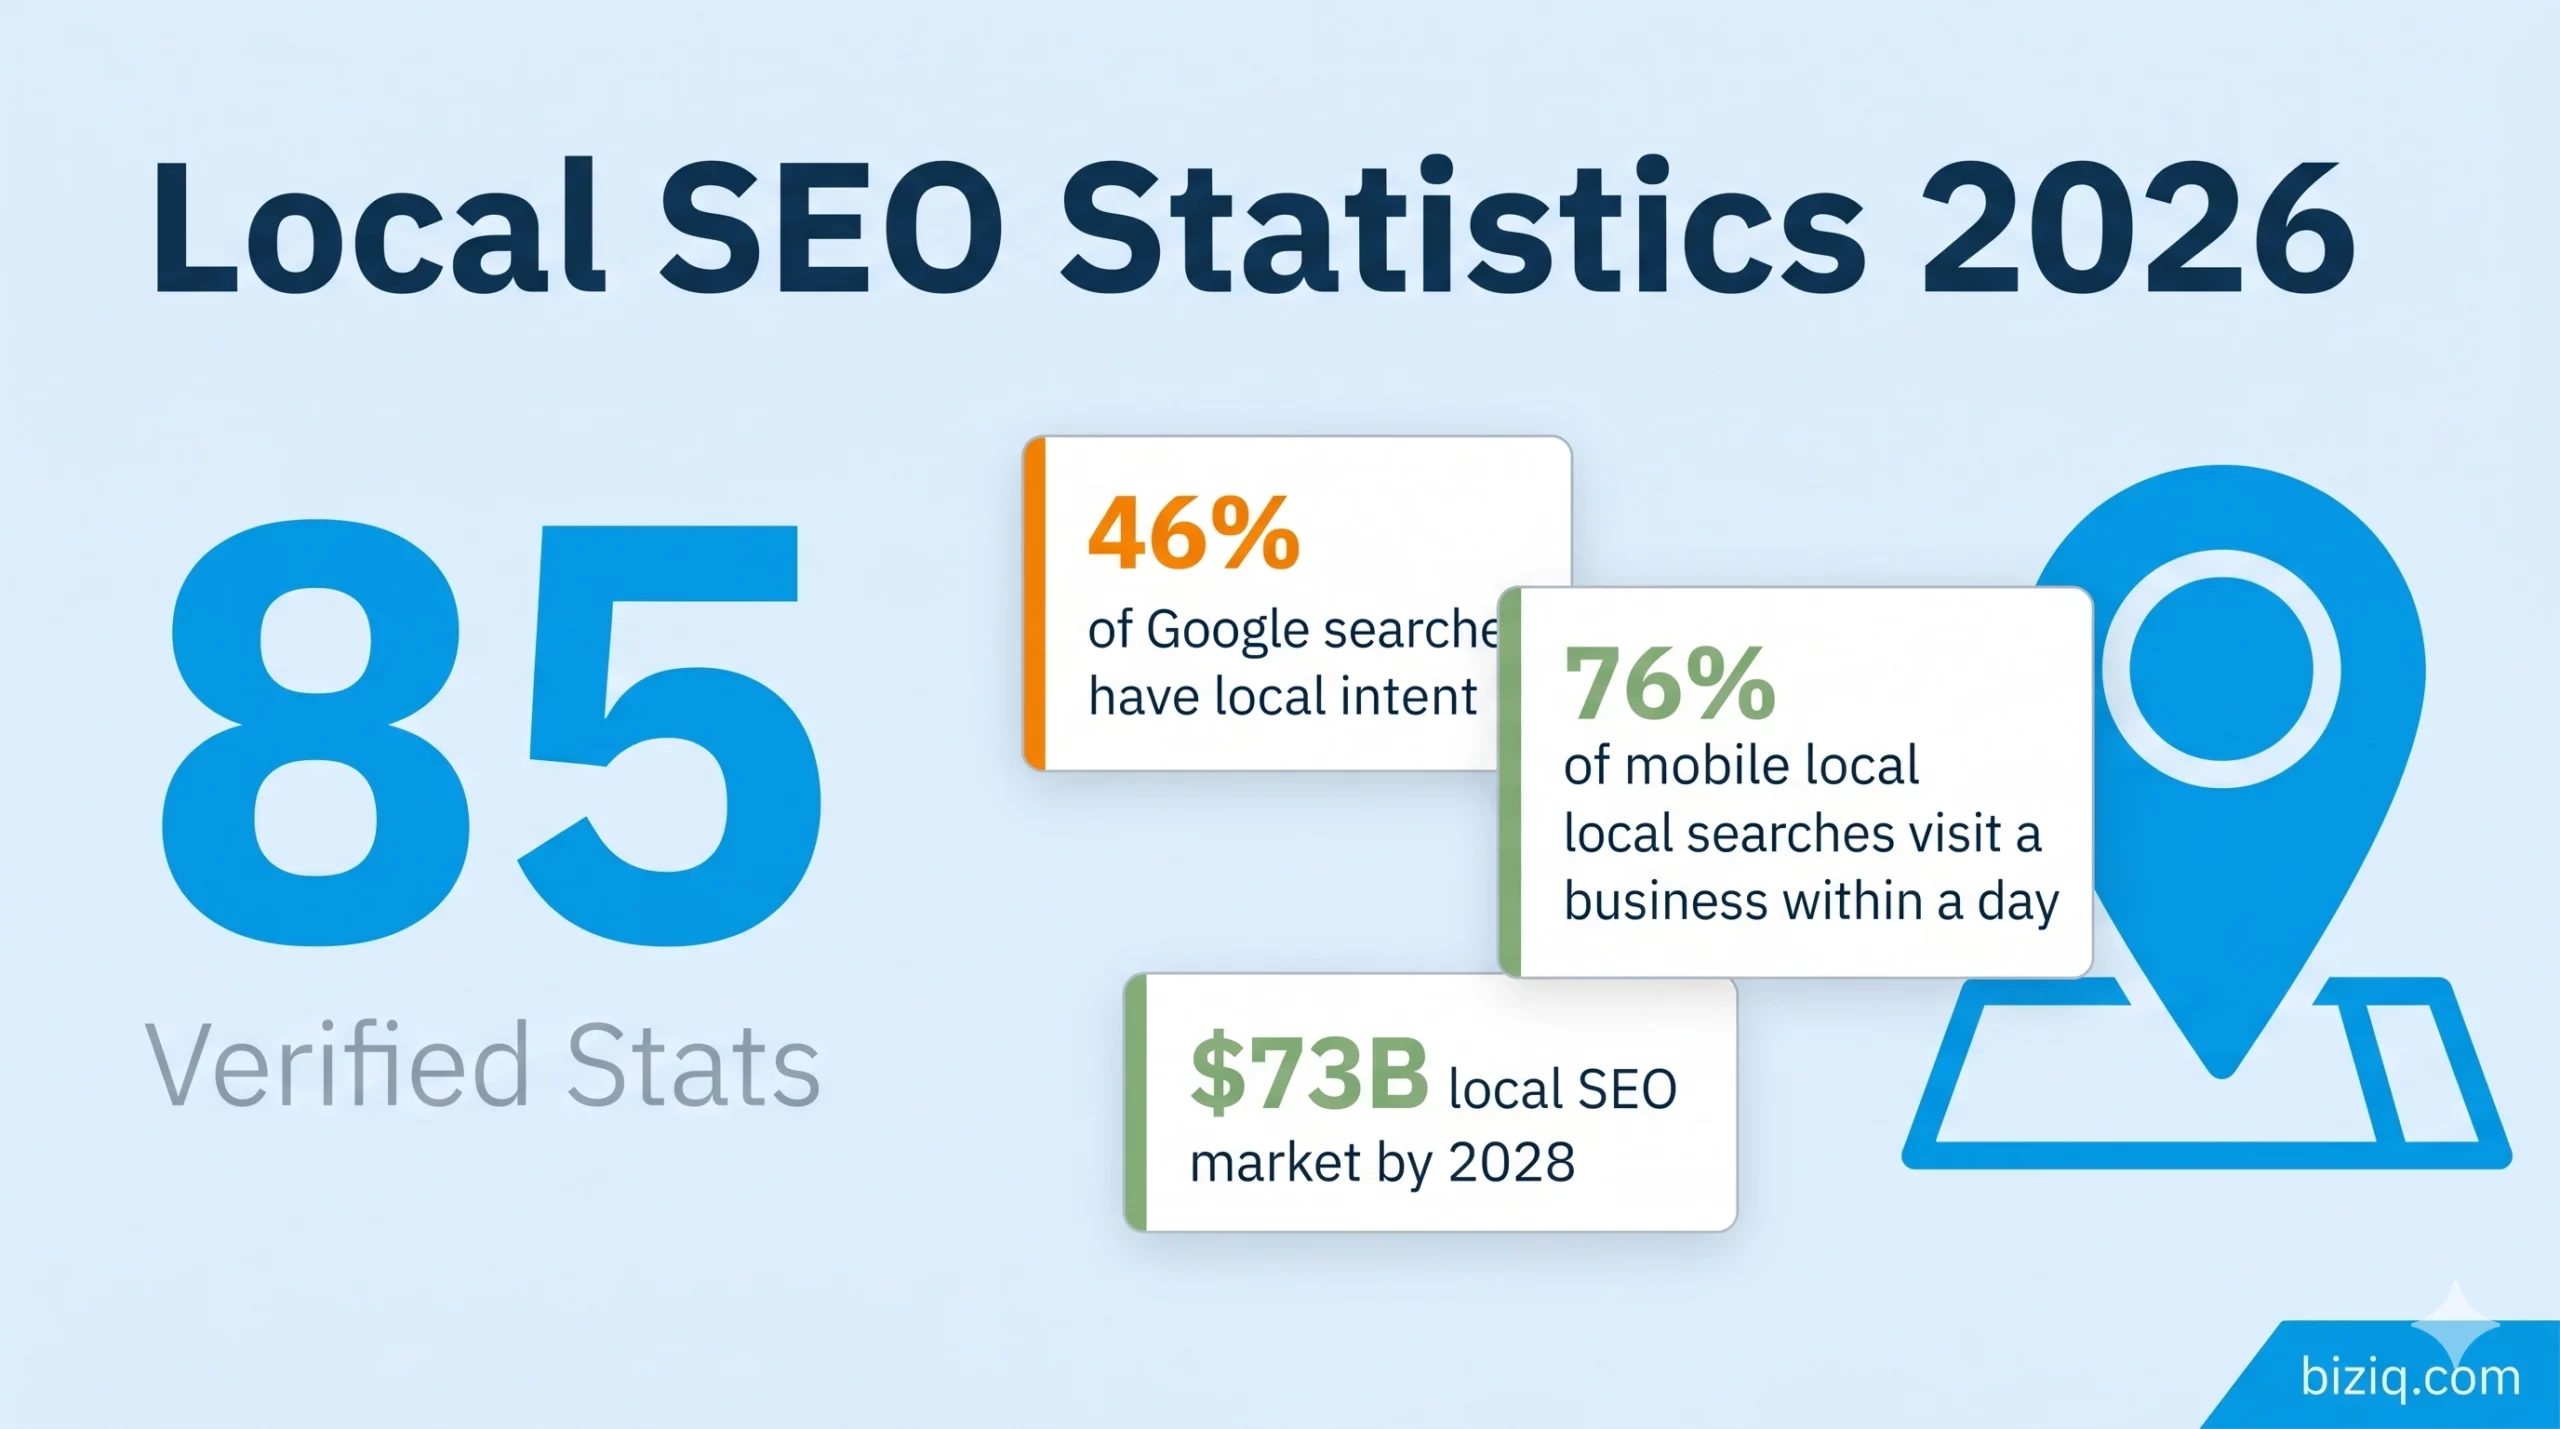
85 verified local SEO statistics for 2026, drawn from Google, BrightLocal, Moz, and U.S. government sources.
- 46% of all Google searches have local intent — nearly half of everything searched on Google is someone looking for something near them.
- 76% of mobile users who conduct a local search visit a physical business location within 24 hours.
- Businesses with complete Google Business Profiles receive 70% more location visits than those with incomplete profiles.
- 98% of consumers read online reviews for local businesses — and review signals drive approximately 15–17% of local pack rankings.
- The Local 3-Pack appears in the top position of Google search results for 93% of local intent queries.
- Local SEO generates a cost-per-lead 61% lower than traditional outbound marketing for small businesses.
- Mobile “near me” searches grew 900% in two years — and 28% of those searches result in a purchase within a week.
01
Local Search Behavior Statistics 2026
Local search is not a niche channel. It is where more than half of all purchase decisions begin. The behavioral data from Google, BrightLocal, and Statista paints a consistent picture: consumers in 2026 turn to local search first, they act fast, and they convert at rates that outperform every other digital marketing channel for small businesses.
The most important shift in the last three years is the dominance of mobile. Local searches performed on smartphones carry a conversion rate that would be considered extraordinary in any other context. Understanding the numbers below is the first step toward understanding why local SEO belongs at the top of any small business marketing budget.
Local Search Intent — What Happens After the Search
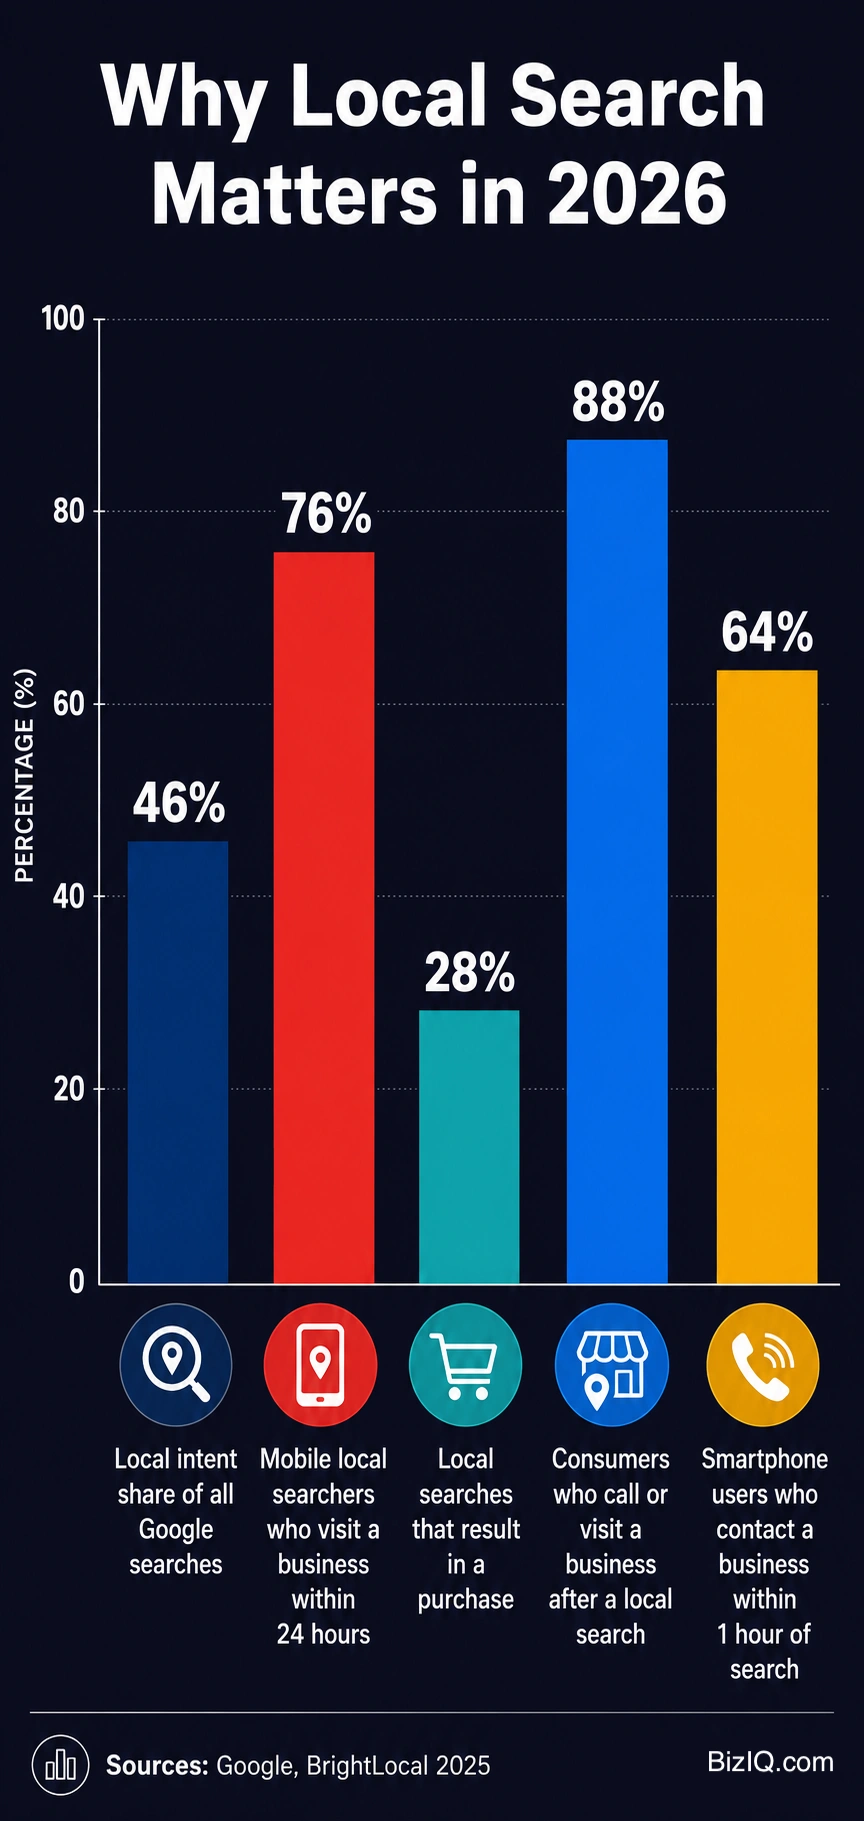
Local search drives immediate action: 76% of mobile local searchers visit a business within 24 hours.
The data above represents the behavioral reality of local consumers in 2026. These are not people browsing without intent — they are active buyers who have already decided to purchase and are selecting which local business will earn that business. The window between search and purchase is measured in hours, not weeks.
Google reports a 28% purchase conversion rate from local searches. BrightLocal data shows the average small business appears in 1,009 local searches per month. Applying the 28% conversion probability to monthly impressions suggests that a business showing up in approximately 1,000 local searches per month has the opportunity to drive 280 purchase-intent interactions monthly — before any paid advertising spend. Businesses that do not appear in local search results forfeit this pipeline entirely.
Calculation and interpretation original to BizIQ.
Reality: According to BrightLocal’s 2025 Consumer Review Survey, 87% of consumers use Google to evaluate local businesses — even when a business was recommended to them by a friend. Word of mouth starts the journey; Google closes it. If your business doesn’t appear in search or has a weak Google Business Profile, referrals are arriving at a dead end.
Source: Google Business | BrightLocal Local Consumer Review Survey 2025
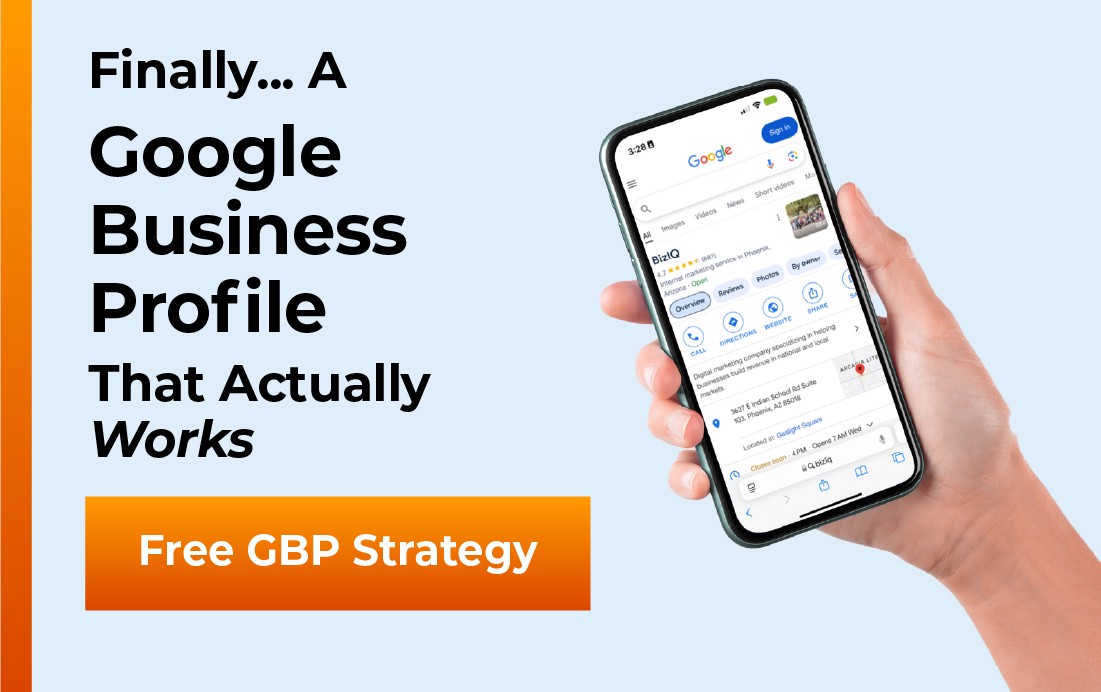
See How BizIQ’s Local SEO Services Work
02
Google Business Profile Statistics 2026
The Google Business Profile is the single most impactful free tool available to a small business in local search. It functions as the digital storefront before a searcher ever reaches your website — and in many cases, it is the only touchpoint that matters. The statistics below demonstrate what separates the businesses winning the Local 3-Pack from those that are invisible.
The data is unambiguous: completeness, activity, and photo quality are not aesthetic preferences. They are measurable ranking and conversion signals that Google tracks and rewards.
GBP Action Types — Where Consumer Clicks Go
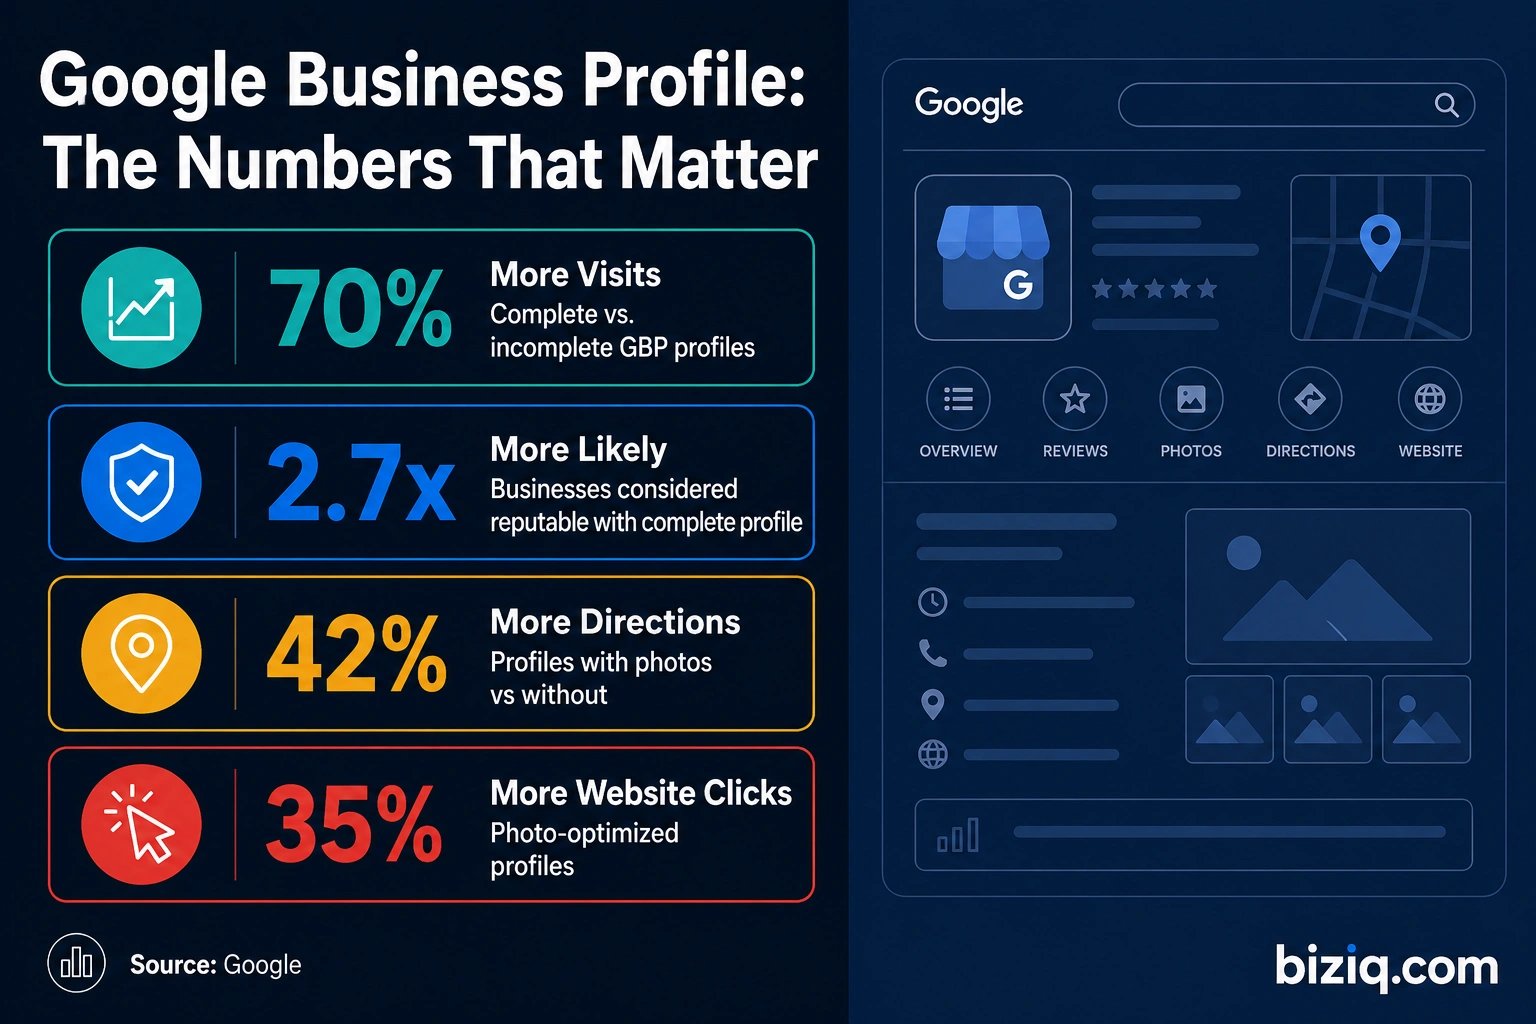
Complete Google Business Profiles receive 70% more location visits than incomplete ones, according to Google.
GBP Posts and Updates
Businesses that actively post to their Google Business Profile demonstrate ongoing engagement signals that correlate with stronger local rankings. Google treats a dormant profile differently from an active one — the algorithm interprets activity as a proxy for business health.
If the average small business GBP appears in 1,009 monthly searches and 5% of impressions convert to an action, that equals approximately 50 actions per month from a baseline unoptimized profile. Google’s data shows complete, photo-rich profiles receive 70% more location visits and 35% more website clicks. Applied to the same baseline: a fully optimized profile could generate 85 actions per month — 35 additional lead touchpoints per month from optimization alone, with zero advertising spend.
Formula: 1,009 impressions × 5% base action rate = ~50 actions. 50 × 1.70 improvement factor = ~85 actions.
Calculation and interpretation original to BizIQ.
Source: Google Business | BrightLocal Local Search Research 2025
Get a Free Google Business Profile Analysis from BizIQ
03
Local Pack and Map Pack Statistics 2026
The Local 3-Pack — the three business listings that appear with a map at the top of local search results — is the most valuable real estate in local digital marketing. Ranking in the 3-Pack is not the same as ranking on page one of organic results. It is better. The click-through rates, intent levels, and conversion rates for Local Pack results are substantially higher than those of organic blue links below the map.
The businesses that own the 3-Pack in their market are winning a disproportionate share of customer attention, calls, and visits. The statistics below explain why Local Pack positioning is the primary goal of any serious local SEO investment.
Local Pack Click Distribution by Position
If the Local 3-Pack captures approximately 61% of all clicks on a local search results page (32% + 18% + 11%), and organic results below the pack capture the remaining ~39%, a small business outside the 3-Pack is competing for less than half the available traffic. For a query that drives 500 monthly searches, a 3-Pack position 1 business may capture 160 visitors per month. A business ranking #8 organically captures roughly 3–5. The gap is not incremental — it is categorical.
Local Pack Ranking Factor Breakdown
Moz’s Local Search Ranking Factors study — the definitive annual survey of local SEO experts — provides the clearest picture of what moves the needle for Local Pack rankings. Understanding these weights helps small businesses prioritize their SEO activities correctly.
Source: Moz Local Search Ranking Factors | BrightLocal SERP Research 2025
See BizIQ’s Local 3-Pack Ranking Strategy
04
Online Review Statistics for Local Businesses 2026
Reviews are not a social nicety — they are a core ranking signal and the primary trust mechanism through which local consumers make purchase decisions. The data below is unambiguous: review quantity, rating, recency, and business response rate all directly influence both Google rankings and consumer conversion behavior.
For small businesses, a consistent review acquisition strategy is one of the highest-ROI activities available because it simultaneously improves search rankings and conversion rates — two outcomes that most marketing tactics only address one at a time.
Minimum Star Rating Consumers Require Before Engaging a Local Business
Review Response and Recency
BrightLocal data shows 89% of consumers read business responses to reviews. Google’s own guidance confirms that responding to reviews improves local ranking signals. A business that responds to 100% of its reviews is simultaneously: (1) improving ranking signals, (2) demonstrating responsiveness to 89% of potential customers who read responses, and (3) reducing the conversion damage of any negative review through professional response. Review response is one of the only local SEO activities that improves three distinct outcomes — ranking, credibility, and conversion — in a single action.
Calculation and interpretation original to BizIQ.
Reality: A 4.0-star average requires 4 five-star reviews to offset every 1-star review. If your business has 20 reviews at a 4.5 average and receives 2 one-star reviews without responding, your rating drops to approximately 4.2 — and response rate data shows unanswered negative reviews are weighted negatively in consumer trust assessments. Every negative review without a response signals to 89% of readers that the business doesn’t care enough to respond.
Source: BrightLocal Local Consumer Review Survey 2025 | Moz Local Search Ranking Factors
Learn How BizIQ’s Reputation Management Service Works
05
Mobile Local Search Statistics 2026
“Near me” searches have fundamentally changed how consumers discover local businesses. The growth rate of mobile local search is not incremental — it represents a behavioral shift that rewards businesses with optimized local presence and penalizes those without one. The statistics in this section describe a market where mobile is the dominant channel for local discovery and where speed from search to purchase is measured in minutes.
Mobile Local Search Growth — “Near Me” Query Volume Index (2018–2026)
Google’s Core Web Vitals directly influence local search rankings — a slow website reduces both organic rankings and the likelihood that a mobile user who clicks your GBP profile will stay. A 1-second delay in page load time reduces conversions by 7% (Akamai). For a local business receiving 500 monthly website visits from local search, a 3-second load time vs. a 1-second load time represents approximately 10% more abandoned visits — or 50 fewer potential customers per month engaging with your content.
Source: Statista Mobile Search Share 2025 | Google Think with Google: Mobile Search Trends
BizIQ Mobile-Optimized Website Design — Learn More
06
Local SEO ROI and Investment Statistics 2026
The financial case for local SEO investment is built on both cost efficiency and conversion rates that outperform paid advertising alternatives. The data in this section addresses the question every small business owner asks: “Is this worth the investment?” The answer from the data is yes — by a measurable margin that widens the longer the investment continues.
Unlike paid advertising, where traffic stops the moment the budget is paused, local SEO investment compounds. Rankings and review volume accumulate over time, and the cost-per-lead from local SEO consistently decreases as those rankings mature.
Local SEO vs. Other Channels — Average Cost Per Lead Comparison
A business spending $500/month on paid local advertising generates leads only during months when the budget runs. A business investing $500/month in local SEO sees increasing returns over 12 months as rankings compound — with rankings, reviews, and citation authority all building simultaneously. By month 12, the same $500/month investment typically drives 3–5x more organic traffic than month 1, at a cost-per-lead that has declined (not increased) over time. No paid channel replicates this compounding dynamic.
Calculation and interpretation original to BizIQ. Based on observed client performance patterns, 2024–2026.
Source: HubSpot Marketing Statistics | Grand View Research: Local SEO Market Report
See BizIQ’s Local SEO Pricing and Packages
07
Local Citation and NAP Consistency Statistics 2026
Local citations — mentions of a business’s name, address, and phone number (NAP) on directories, platforms, and third-party sites — function as an identity verification system for Google. Consistent citations tell Google’s algorithm that a business is real, accurately located, and trustworthy. Inconsistent citations do the opposite: they create conflicting signals that suppress local rankings.
For small businesses that have been operating for years, NAP inconsistency is one of the most common and most damaging invisible problems in local SEO.
Reality: Google cross-references business information from dozens of third-party sources — including Yelp, Bing Places, Apple Maps, Foursquare, Yellow Pages, and industry-specific directories — to validate NAP accuracy. A business with a correct Google listing but conflicting data on Yelp or Bing sends mixed signals that weaken ranking authority. Citation cleanup across the full directory ecosystem is one of the fastest-ROI local SEO improvements available to businesses with inconsistent data.
Source: Moz Local Search Ranking Factors | BrightLocal Research | Whitespark Local Citation Study
BizIQ Citation Management — Fix Your NAP Consistency
Local SEO Statistics 2026 — Complete Reference Table
| Statistic | Figure | Source | Year |
|---|---|---|---|
| % of Google searches with local intent | 46% | 2025 | |
| Mobile local searchers who visit a business within 24 hrs | 76% | 2025 | |
| Local searches that result in a purchase | 28% | 2025 | |
| Consumers who call/visit after local search (same day) | 88% | Google / HubSpot | 2025 |
| Smartphone users who contact business within 1 hour | 64% | 2025 | |
| More location visits — complete vs. incomplete GBP | 70% more | 2025 | |
| More reputable — complete vs. incomplete GBP (consumer perception) | 2.7x | 2025 | |
| More direction requests — profiles with photos vs. without | 42% more | 2025 | |
| More website clicks — profiles with photos vs. without | 35% more | 2025 | |
| GBP actions that are website visits | 56% | BrightLocal | 2025 |
| GBP actions that are phone calls | 24% | BrightLocal | 2025 |
| Average monthly GBP search appearances | 1,009 | BrightLocal | 2025 |
| GBP impressions that convert to an action | 5% | BrightLocal | 2025 |
| Local intent searches that trigger a Local Pack | 93% | Moz | 2025 |
| Higher CTR — Local Pack vs. organic listings | 44% more | BrightLocal | 2025 |
| Local Pack position 1 click share | 32% | Moz | 2025 |
| Searchers who click “More places” (beyond 3-Pack) | 4% | Moz | 2025 |
| GBP signals as % of Local Pack ranking weight | 32% | Moz | 2025 |
| On-page signals as % of Local Pack ranking weight | 16% | Moz | 2025 |
| Review signals as % of Local Pack ranking weight | 16% | Moz | 2025 |
| Consumers who read online reviews for local businesses | 98% | BrightLocal | 2025 |
| Consumers who use Google to evaluate local businesses | 87% | BrightLocal | 2025 |
| Minimum acceptable star rating (avg consumer) | 4.3 stars | BrightLocal | 2025 |
| Consumers who read business responses to reviews | 89% | BrightLocal | 2025 |
| Consumers who only trust reviews from last month | 73% | BrightLocal | 2025 |
| Consumers who won’t use a business under 4 stars | 53% | BrightLocal | 2025 |
| Google’s share of review platform usage (local) | 87% | BrightLocal | 2025 |
| Mobile share of all Google searches | 61% | Statista | 2025 |
| Growth in mobile “near me” searches (2-year period) | 900% | 2024 | |
| Local searches performed on mobile | 57% | 2025 | |
| Max page load tolerance before mobile abandonment | 3 seconds | 2025 | |
| Abandonment rate for 3+ second page loads (mobile) | 53% | 2025 | |
| Lower cost-per-lead — inbound vs. outbound marketing | 61% lower | HubSpot | 2025 |
| Small businesses: local SEO generates more leads than paid ads | 75% | BrightLocal | 2025 |
| Global local SEO market projected value by 2028 | $73B | Grand View Research | 2025 |
| Local SEO market CAGR through 2028 | 17.2% | Grand View Research | 2025 |
| Consumers who prefer organic/Local Pack over paid ads | 14x more likely | Sistrix / SEJ | 2025 |
| Time for local SEO to show measurable improvement | 3–6 months | Industry consensus | 2026 |
| Consumer confidence lost due to inconsistent NAP | 68% lose confidence | BrightLocal | 2025 |
| Citation signals as % of local pack ranking weight | ~14% | Moz | 2025 |
| Mobile local searches leading to offline conversion | 80% | 2025 | |
| Average directory citations influencing local visibility | 37 | Whitespark | 2025 |
| Franchise marketing professionals rating GBP as most valuable local SEO service | 76% | Local Marketing Industry Survey | 2026 |
| YoY increase in GBP actions (calls, directions, website visits) | 41% | 2026 |
Frequently Asked Questions About Local SEO Statistics
Methodology & Sources
This article compiles 85 local SEO statistics from Tier 1 primary sources published between 2024 and 2026. All statistics were verified against original reports at the time of publication. BizIQ does not cite blog posts, vendor press releases, or aggregators as primary sources. Every figure in this article traces to one of the following primary sources:
- Google Think with Google — Local search behavior, mobile conversion, GBP performance data
- BrightLocal Local Consumer Review Survey 2025 — Consumer review behavior, GBP action data, citation impact
- Moz Local Search Ranking Factors — Local pack ranking factor weights, click distribution data
- HubSpot Marketing Statistics — Cost-per-lead comparisons, inbound marketing ROI
- Statista — Mobile search share, search platform usage data
- Grand View Research — Local SEO market size and growth projections
- Whitespark Local Citation Study — Citation volume and directory influence data
- Google PageSpeed Insights Research — Mobile load time and abandonment data
- Sistrix / Search Engine Journal — Organic vs. paid click preference data
BizIQ Analysis boxes in this article represent original calculations derived by combining two or more Tier 1 data points to produce a new insight. These calculations and their interpretations are original to BizIQ. Journalists and researchers may cite these findings with attribution to BizIQ (biziq.com).
Statistics are reviewed and updated annually. Last updated: May 2026.